Select Range
range of days
TO
Current Trend
Sessions
%
PREVIOUS
CURRENT
CONVERSIONS
%
PREVIOUS
CURRENT
Spend
%
PREVIOUS
CURRENT
Conversion Costs
%
PREVIOUS
CURRENT
Overall Health
Sessions by Region
START
END
Users
Conversion Rate
%
Top Pages
Campaign Health
PPC
Email
Banners
3rd Party
CONVERSIONS
TARGET
Referring Domains
%
START
END
Branded Searches
%
START
END
Online Sales
%
START
END
Top Unbranded Keywords
?
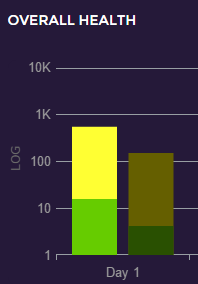 The bar chart uses a logarithmic scale on the Y axis in order to show two sets of data that vary in amounts. Notice how conversions (relatively small numbers in green) are plotted on the chart at the bottom where the scale starts at 1 and increases to 100. The sessions (relatively large numbers in yellow) are plotted at the top of the chart where the scale goes quickly from 1,000 to 10,000. This approach allows two data sets of varying scale to exist in a stacked layout on the chart.
Social Trend