ui.igBulletGraph
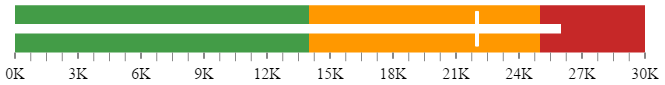
コード サンプル
<!DOCTYPE html>
<html>
<head>

    <!-- Ignite UI Required Combined CSS Files -->
    <link href="../../igniteui/css/themes/infragistics/infragistics.theme.css" rel="stylesheet" />
    <link href="../../igniteui/css/structure/infragistics.css" rel="stylesheet" />

    <!-- Used to style the API Viewer and Explorer UI -->
    <link href="../../css/apiviewer.css" rel="stylesheet" type="text/css" />

    <script src="../../js/modernizr.min.js"></script>
    <script src="../../js/jquery.min.js"></script>
    <script src="../../js/jquery-ui.min.js"></script>

    <!-- Ignite UI Required Combined JavaScript Files -->
    <script src="../../igniteui/js/infragistics.core.js"></script>
    <script src="../../igniteui/js/infragistics.dv.js"></script>

</head>
<body>
    <div id="bulletgraph" ></div>

    <script type="text/javascript">
        $(function () {
            $("#bulletgraph").igBulletGraph({
                height: "80px",
                width: "100%",
                minimumValue: 0,
                maximumValue: 30,
                value: 26,
                targetValue: 22,
                ranges: [
                    {
                        name: 'bad',
                        startValue: 0,
                        endValue: 14
                    },
                    {
                        name: 'acceptable',
                        startValue: 14,
                        endValue: 25
                    },
                    {
                        name: 'good',
                        startValue: 25,
                        endValue: 30
                    }],
                transitionDuration: 1000,
                formatLabel: function (evt, ui) {
                        ui.label = ui.label+"K";
                    }
            });
        });
    </script>
</body>
</html>
関連サンプル
関連トピック
依存関係
-
backingBrush
- タイプ:
- string
- デフォルト:
- null
ブレット グラフのバッキングを塗りつぶすために使用するブラシを取得または設定します。
コード サンプル
// Initialize $(".selector").igBulletGraph({ backingBrush: "#164F6D" }); // Get var backingBrush = $(".selector").igBulletGraph("option", "backingBrush"); // Set $(".selector").igBulletGraph("option", "backingBrush", "#164F6D"); -
backingInnerExtent
- タイプ:
- number
- デフォルト:
- 0
ブレット グラフ バッキングの内側範囲を取得または設定します。
コード サンプル
// Initialize $(".selector").igBulletGraph({ backingInnerExtent: 0.3 }); // Get var backingInnerExtent = $(".selector").igBulletGraph("option", "backingInnerExtent"); // Set $(".selector").igBulletGraph("option", "backingInnerExtent", 0.3); -
backingOuterExtent
- タイプ:
- number
- デフォルト:
- 1
ブレット グラフ バッキングの外側範囲を取得または設定します。
コード サンプル
// Initialize $(".selector").igBulletGraph({ backingOuterExtent: 0.65 }); // Get var backingOuterExtent = $(".selector").igBulletGraph("option", "backingOuterExtent"); // Set $(".selector").igBulletGraph("option", "backingOuterExtent", 0.65); -
backingOutline
- タイプ:
- string
- デフォルト:
- null
バッキングのアウトラインを使用するブラシを取得または設定します。
コード サンプル
// Initialize $(".selector").igBulletGraph({ backingOutline: "#164F6D" }); // Get var backingOutline = $(".selector").igBulletGraph("option", "backingOutline"); // Set $(".selector").igBulletGraph("option", "backingOutline", "#164F6D"); -
backingStrokeThickness
- タイプ:
- number
- デフォルト:
- 2
バッキング アウトラインのストロークの太さを取得または設定します。
コード サンプル
// Initialize $(".selector").igBulletGraph({ backingStrokeThickness: 3 }); // Get var backingStrokeThickness = $(".selector").igBulletGraph("option", "backingStrokeThickness"); // Set $(".selector").igBulletGraph("option", "backingStrokeThickness", 3); -
font
- タイプ:
- string
- デフォルト:
- null
フォントを取得または設定します。
コード サンプル
// Initialize $(".selector").igBulletGraph({ font: "20px Georgia" }); // Get var font = $(".selector").igBulletGraph("option", "font"); // Set $(".selector").igBulletGraph("option", "font", "20px Georgia"); -
fontBrush
- タイプ:
- string
- デフォルト:
- null
ラベル フォントを使用するためのブラシを取得または設定します。
コード サンプル
// Initialize $(".selector").igBulletGraph({ fontBrush: "#164F6D" }); // Get var fontBrush = $(".selector").igBulletGraph("option", "fontBrush"); // Set $(".selector").igBulletGraph("option", "fontBrush", "#164F6D"); -
height
- タイプ:
- enumeration
- デフォルト:
- null
ゲージの高さ。ピクセル、文字列 (px)、またはパーセンテージ (%) で数字として設定できます。
メンバー
- string
- ウィジェットの高さはピクセル (px) およびパーセント (%) で設定できます (%)。
- number
- ウィジェットの高さは数値として設定できます。
コード サンプル
// Initialize $(".selector").igBulletGraph({ height: "150px" }); // Get var height = $(".selector").igBulletGraph("option", "height"); // Set $(".selector").igBulletGraph("option", "height", "150px"); -
interval
- タイプ:
- number
- デフォルト:
- 0
スケールに使用する間隔を取得または設定します。
コード サンプル
// Initialize $(".selector").igBulletGraph({ interval: 15 }); // Get var interval = $(".selector").igBulletGraph("option", "interval"); // Set $(".selector").igBulletGraph("option", "interval", 15); -
isScaleInverted
- タイプ:
- bool
- デフォルト:
- false
スケールが反転されるかどうかを示す値を取得または設定します。
スケールが反転された場合、スケール値が右から左へ増加します。コード サンプル
// Initialize $(".selector").igBulletGraph({ isScaleInverted: true }); // Get var isScaleInverted = $(".selector").igBulletGraph("option", "isScaleInverted"); // Set $(".selector").igBulletGraph("option", "isScaleInverted", true); -
labelExtent
- タイプ:
- number
- デフォルト:
- 0
スケールの下から計測される、0 から 1 の値でラベルを配置する位置を取得または設定します。
0.5 から 1 の間の値を使用し、ブレット グラフのラベルを非表示できます。コード サンプル
// Initialize $(".selector").igBulletGraph({ labelExtent: 0.65 }); // Get var labelExtent = $(".selector").igBulletGraph("option", "labelExtent"); // Set $(".selector").igBulletGraph("option", "labelExtent", 0.65); -
labelInterval
- タイプ:
- number
- デフォルト:
- 0
ラベルの描画に使用する間隔を取得または設定します。このデフォルトは、スケールの目盛と同じ間隔です。
コード サンプル
// Initialize $(".selector").igBulletGraph({ labelInterval: 15 }); // Get var labelInterval = $(".selector").igBulletGraph("option", "labelInterval"); // Set $(".selector").igBulletGraph("option", "labelInterval", 15); -
labelsPostInitial
- タイプ:
- number
- デフォルト:
- 0
ラベルの追加を開始するための値で、スケールの MinimumValue に追加されます。
コード サンプル
// Initialize $(".selector").igBulletGraph({ labelsPostInitial: 5000 }); // Get var labelsPostInitial = $(".selector").igBulletGraph("option", "labelsPostInitial"); // Set $(".selector").igBulletGraph("option", "labelsPostInitial", 5000); -
labelsPreTerminal
- タイプ:
- number
- デフォルト:
- 0
スケールの MaximumValue から差し引かれた、ラベルの追加を停止する値。
コード サンプル
// Initialize $(".selector").igBulletGraph({ labelsPreTerminal: 5000 }); // Get var labelsPreTerminal = $(".selector").igBulletGraph("option", "labelsPreTerminal"); // Set $(".selector").igBulletGraph("option", "labelsPreTerminal", 5000); -
maximumValue
- タイプ:
- number
- デフォルト:
- 100
スケールの最大値を取得または設定します。
コード サンプル
// Initialize $(".selector").igBulletGraph({ maximumValue: 5000 }); // Get var maximumValue = $(".selector").igBulletGraph("option", "maximumValue"); // Set $(".selector").igBulletGraph("option", "maximumValue", 5000); -
minimumValue
- タイプ:
- number
- デフォルト:
- 0
スケールの最小値を取得または設定します。
コード サンプル
// Initialize $(".selector").igBulletGraph({ minimumValue: 500 }); // Get var minimumValue = $(".selector").igBulletGraph("option", "minimumValue"); // Set $(".selector").igBulletGraph("option", "minimumValue", 500); -
minorTickBrush
- タイプ:
- string
- デフォルト:
- null
副目盛に使用するブラシを取得または設定します。
コード サンプル
// Initialize $(".selector").igBulletGraph({ minorTickBrush: "blue" }); // Get var minorTickBrush = $(".selector").igBulletGraph("option", "minorTickBrush"); // Set $(".selector").igBulletGraph("option", "minorTickBrush", "blue"); -
minorTickCount
- タイプ:
- number
- デフォルト:
- 3
2 つの主要目盛間の補助目盛の数を取得または設定します。
コード サンプル
// Initialize $(".selector").igBulletGraph({ minorTickCount: 5 }); // Get var minorTickCount = $(".selector").igBulletGraph("option", "minorTickCount"); // Set $(".selector").igBulletGraph("option", "minorTickCount", 5); -
minorTickEndExtent
- タイプ:
- number
- デフォルト:
- 0.2
ブレットグラフの前/下から計測される、0 から 1 の値で副目盛の描画を停止する位置を取得または設定します。
0.5 から 1 の間の値を使用し、ブレットグラフの標準サイズを超えて拡張できます。コード サンプル
// Initialize $(".selector").igBulletGraph({ minorTickEndExtent: .5 }); // Get var minorTickEndExtent = $(".selector").igBulletGraph("option", "minorTickEndExtent"); // Set $(".selector").igBulletGraph("option", "minorTickEndExtent", .5); -
minorTickStartExtent
- タイプ:
- number
- デフォルト:
- 0.06
ブレットグラフの前/下から計測された、0 から 1 の値で副目盛の描画を開始する位置を取得または設定します。
0.5 から 1 の間の値を使用し、ブレットグラフの標準サイズを超えて拡張できます。コード サンプル
// Initialize $(".selector").igBulletGraph({ minorTickStartExtent: .05 }); // Get var minorTickStartExtent = $(".selector").igBulletGraph("option", "minorTickStartExtent"); // Set $(".selector").igBulletGraph("option", "minorTickStartExtent", .05); -
minorTickStrokeThickness
- タイプ:
- number
- デフォルト:
- 1
副メモリを描画がする際に使用するストロークの太さを取得または設定します。
コード サンプル
// Initialize $(".selector").igBulletGraph({ minorTickStrokeThickness: 4 }); // Get var minorTickStrokeThickness = $(".selector").igBulletGraph("option", "minorTickStrokeThickness"); // Set $(".selector").igBulletGraph("option", "minorTickStrokeThickness", 4); -
orientation
- タイプ:
- enumeration
- デフォルト:
- horizontal
スケールの向きを取得または設定します。
メンバー
- horizontal
- タイプ:string
- .
- vertical
- タイプ:string
コード サンプル
// Initialize $(".selector").igBulletGraph({ orientation: "vertical" }); // Get var orientation = $(".selector").igBulletGraph("option", "orientation"); // Set $(".selector").igBulletGraph("option", "orientation", "vertical"); -
pixelScalingRatio
- タイプ:
- number
- デフォルト:
- 0
コード サンプル
// Initialize $(".selector").igBulletGraph({ pixelScalingRatio: 2 }); // Get var pixelScalingRatio = $(".selector").igBulletGraph("option", "pixelScalingRatio"); // Set $(".selector").igBulletGraph("option", "pixelScalingRatio", 2); -
rangeBrushes
- タイプ:
- object
- デフォルト:
- null
ブレット グラフ範囲のパレットとして使用されるブラシのコレクションを取得または設定します。
提供された値は、css 色文字列またはグラデーションを定義する JavaScript オブジェクトの配列である必要があります。最初の要素は、コレクションの補間モードを指定する RGB または HSV の文字列に設定するオプションがあります。コード サンプル
// Initialize $(".selector").igBulletGraph({ rangeBrushes: ["#164F6D", "green", "#AF3", "yellow"], }); // Get var rangeBrushes = $(".selector").igBulletGraph("option", "rangeBrushes"); // Set $(".selector").igBulletGraph("option", "rangeBrushes", ["#164F6D", "green", "#AF3", "yellow"]); -
rangeInnerExtent
- タイプ:
- number
- デフォルト:
- 0.2
0 から 1 の値でコントロールの前と下から計測された、描画を開始する位置を取得または設定します。
0.5 から 1 の間の値を使用し、ブレットグラフの標準サイズを超えて拡張できます。コード サンプル
// Initialize $(".selector").igBulletGraph({ rangeInnerExtent: 0.4, }); // Get var rangeInnerExtent = $(".selector").igBulletGraph("option", "rangeInnerExtent"); // Set $(".selector").igBulletGraph("option", "rangeInnerExtent", 0.4); -
rangeOuterExtent
- タイプ:
- number
- デフォルト:
- 0.95
ブレットグラフの前/下から計測された、0 から 1 の値で範囲の描画を停止する位置を取得または設定します。
0.5 から 1 の間の値を使用し、ブレットグラフの標準サイズを超えて拡張できます。コード サンプル
// Initialize $(".selector").igBulletGraph({ rangeOuterExtent: 0.4, }); // Get var rangeOuterExtent = $(".selector").igBulletGraph("option", "rangeOuterExtent"); // Set $(".selector").igBulletGraph("option", "rangeOuterExtent", 0.4); -
rangeOutlines
- タイプ:
- object
- デフォルト:
- null
ブレット グラフ アウトラインのパレットとして使用されるブラシのコレクションを取得または設定します。
提供された値は、css 色文字列またはグラデーションを定義する JavaScript オブジェクトの配列である必要があります。最初の要素は、コレクションの補間モードを指定する RGB または HSV の文字列に設定するオプションがあります。コード サンプル
// Initialize $(".selector").igBulletGraph({ rangeOutlines: ["#164F6D", "green", "#AF3", "yellow"], }); // Get var rangeOutlines = $(".selector").igBulletGraph("option", "rangeOutlines"); // Set $(".selector").igBulletGraph("option", "rangeOutlines", ["#164F6D", "green", "#AF3", "yellow"]); -
ranges
- タイプ:
- array
- デフォルト:
- []
- 要素タイプ:
- object
ブレット グラフで描画するためのスケールの範囲を取得または設定します。
コード サンプル
// Initialize $(".selector").igBulletGraph({ ranges: [ { name: 'bad', startValue: 0, endValue: 50 }, { name: 'acceptable', startValue: 50, endValue: 80 }, { name: 'good', startValue: 80, endValue: 100 } ] }); // Get var ranges = $(".selector").igBulletGraph("option", "ranges"); // Set $(".selector").igBulletGraph("option", "ranges", [ { name: 'bad', startValue: 0, endValue: 50 }, { name: 'acceptable', startValue: 50, endValue: 80 }, { name: 'good', startValue: 80, endValue: 100 } ]);-
brush
- タイプ:
- string
- デフォルト:
- null
範囲を塗りつぶすために使用するブラシを取得または設定します。
コード サンプル
//Initialize $(".selector").igBulletGraph({ ranges: [ { name: "range1", brush: "rgba(164, 189, 41, 1)" } ] }); //Get var ranges = $(".selector").igBulletGraph("option", "ranges"); var brush = ranges[0].brush; //Set $(".selector").igBulletGraph("option", "ranges", [{name: "range1", brush:"red" }]); -
endValue
- タイプ:
- number
- デフォルト:
- 0
スケールに沿って範囲を終了する値を取得または設定します。
コード サンプル
//Initialize $(".selector").igBulletGraph({ ranges: [ { name: "range1", endValue: 50 } ] }); //Get var ranges = $(".selector").igBulletGraph("option", "ranges"); var endValue = ranges[0].endValue; //Set $(".selector").igBulletGraph("option", "ranges", [{name: "range1", endValue: 50 }]); -
innerEndExtent
- タイプ:
- number
- デフォルト:
- 0
範囲の内側の移動を描画を終了するゲージの前/下からの距離 (0 から 1) を取得または設定します。
0.5 から 1 の間の値を使用し、ブレットグラフの標準幅/高さを超えて拡張できます。コード サンプル
//Initialize $(".selector").igBulletGraph({ ranges: [ { name: "range1", innerEndExtent: 0.2 } ] }); //Get var ranges = $(".selector").igBulletGraph("option", "ranges"); var innerEndExtent = ranges[0].innerEndExtent; //Set $(".selector").igBulletGraph("option", "ranges", [{name: "range1", innerEndExtent: 0.2 }]); -
innerStartExtent
- タイプ:
- number
- デフォルト:
- 0
範囲の内側の移動を描画を開始するゲージの前/下からの距離 (0 から 1) を取得または設定します。
0.5 から 1 の間の値を使用し、ブレットグラフの標準幅/高さを超えて拡張できます。コード サンプル
//Initialize $(".selector").igBulletGraph({ ranges: [ { name: "range1", innerStartExtent: 0.2 } ] }); //Get var ranges = $(".selector").igBulletGraph("option", "ranges"); var innerStartExtent = ranges[0].innerStartExtent; //Set $(".selector").igBulletGraph("option", "ranges", [{name: "range1", innerStartExtent: 0.2 }]); -
name
- タイプ:
- string
- デフォルト:
- null
範囲の名前を取得または設定します。
コード サンプル
//Initialize $(".selector").igBulletGraph({ ranges: [ { name: "range1" } ] }); //Get var ranges = $(".selector").igBulletGraph("option", "ranges"); var name = ranges[0].name; -
outerEndExtent
- タイプ:
- number
- デフォルト:
- 0
範囲の外側の移動を描画を終了するゲージの前/下からの距離 (0 から 1) を取得または設定します。
0.5 から 1 の間の値を使用し、ブレットグラフの標準幅/高さを超えて拡張できます。コード サンプル
//Initialize $(".selector").igBulletGraph({ ranges: [ { name: "range1", outerEndExtent: 0.8 } ] }); //Get var ranges = $(".selector").igBulletGraph("option", "ranges"); var outerEndExtent = ranges[0].outerEndExtent; //Set $(".selector").igBulletGraph("option", "ranges", [{name: "range1", outerEndExtent: 0.8 }]); -
outerStartExtent
- タイプ:
- number
- デフォルト:
- 0
範囲の外部スイープの描画を開始する、ブレットグラフの前/下から計測された距離 (0 から 1) を取得または設定します。
0.5 から 1 の間の値を使用し、ブレットグラフの標準幅/高さを超えて拡張できます。コード サンプル
//Initialize $(".selector").igBulletGraph({ ranges: [ { name: "range1", outerStartExtent: 0.8 } ] }); //Get var ranges = $(".selector").igBulletGraph("option", "ranges"); var outerStartExtent = ranges[0].outerStartExtent; //Set $(".selector").igBulletGraph("option", "ranges", [{name: "range1", outerStartExtent: 0.8 }]); -
outline
- タイプ:
- string
- デフォルト:
- null
範囲を描画する際に使用するアウトラインを取得または設定します。
コード サンプル
//Initialize $(".selector").igBulletGraph({ ranges: [ { name: "range1", outline: "green" } ] }); //Get var ranges = $(".selector").igBulletGraph("option", "ranges"); var outline = ranges[0].outline; //Set $(".selector").igBulletGraph("option", "ranges", [{ name: "range1", outline: "green" }]); -
startValue
- タイプ:
- number
- デフォルト:
- 0
スケールに沿って範囲を開始する値を取得または設定します。
コード サンプル
//Initialize $(".selector").igBulletGraph({ ranges: [ { name: "range1", startValue: 20 } ] }); //Get var ranges = $(".selector").igBulletGraph("option", "ranges"); var startValue = ranges[0].startValue; //Set $(".selector").igBulletGraph("option", "ranges", [{name: "range1", startValue: 20 }]); -
strokeThickness
- タイプ:
- number
- デフォルト:
- 1
この範囲のアウトラインを描画するときに使用するストロークの太さを取得または設定します。
コード サンプル
//Initialize
$(".selector").igBulletGraph({
    ranges: [
        { name: "range1", strokeThickness: 3 }
    ]
});

//Get
var ranges = $(".selector").igBulletGraph("option", "ranges");
var strokeThickness = ranges[0].strokeThickness;

//Set
$(".selector").igBulletGraph("option", "ranges", [{ name: "range1", strokeThickness: 3 }]);
-
rangeToolTipTemplate
- タイプ:
- string
- デフォルト:
- null
範囲のツールチップ テンプレートを取得または設定します。
コード サンプル
<script id="myRangeToolTipTemplateScript" type="text/x-jquery-tmpl"> <div class='ui-bulletgraph-range-tooltip' > <font color='${itemBrush}'> ${item.name} : ${item.startValue}% - ${item.endValue}% </font> </div> </script> // Initialize $(".selector").igBulletGraph({ showToolTip: true, rangeTooltipTemplate: "myRangeToolTipTemplateScript" }); // Get var rangeToolTipTemplate = $(".selector").igBulletGraph("option", "rangeToolTipTemplate"); // Set $(".selector").igBulletGraph("option", "rangeToolTipTemplate", "myRangeToolTipTemplateScript"); -
scaleEndExtent
- タイプ:
- number
- デフォルト:
- 0.95
ブレットグラフの前/下から計測された、0 から 1 の値でスケールの描画を停止する位置を取得または設定します。
0.5 から 1 の間の値を使用し、ブレットグラフの標準サイズを超えて拡張できます。コード サンプル
// Initialize $(".selector").igBulletGraph({ scaleEndExtent: .7 }); // Get var scaleEndExtent = $(".selector").igBulletGraph("option", "scaleEndExtent"); // Set $(".selector").igBulletGraph("option", "scaleEndExtent", .7); -
scaleStartExtent
- タイプ:
- number
- デフォルト:
- 0.05
0 から 1 の値でブレット グラフの前/下から計測された、スケールの描画を開始する位置を取得または設定します。
0.5 から 1 の間の値を使用し、ブレットグラフの標準サイズを超えて拡張できます。コード サンプル
// Initialize $(".selector").igBulletGraph({ scaleStartExtent: .1 }); // Get var scaleStartExtent = $(".selector").igBulletGraph("option", "scaleStartExtent"); // Set $(".selector").igBulletGraph("option", "scaleStartExtent", .1); -
showToolTip
- タイプ:
- bool
- デフォルト:
- false
ツールチップが有効されるかどうかを示す値を取得または設定します。
コード サンプル
// Initialize $(".selector").igBulletGraph({ showToolTip: true }); // Get var showToolTip = $(".selector").igBulletGraph("option", "showToolTip"); // Set $(".selector").igBulletGraph("option", "showToolTip", true); -
showToolTipTimeout
- タイプ:
- number
- デフォルト:
- 0
ツールチップの表示を遅延するミリ秒を取得または設定します。
コード サンプル
// Initialize $(".selector").igBulletGraph({ showToolTipTimeout: 2000 }); // Get var showToolTipTimeout = $(".selector").igBulletGraph("option", "showToolTipTimeout"); // Set $(".selector").igBulletGraph("option", "showToolTipTimeout", 2000); -
targetValue
- タイプ:
- number
- デフォルト:
- 0
ターゲット値バーで示された値を取得または設定します。
コード サンプル
// Initialize $(".selector").igBulletGraph({ targetValue: 30 }); // Get var targetValue = $(".selector").igBulletGraph("option", "targetValue"); // Set $(".selector").igBulletGraph("option", "targetValue", 30); -
targetValueBreadth
- タイプ:
- number
- デフォルト:
- 3
ターゲット値要素の幅を取得または設定します。
コード サンプル
// Initialize $(".selector").igBulletGraph({ targetValueBreadth: 5 }); // Get var targetValueBreadth = $(".selector").igBulletGraph("option", "targetValueBreadth"); // Set $(".selector").igBulletGraph("option", "targetValueBreadth", 5); -
targetValueBrush
- タイプ:
- string
- デフォルト:
- null
比較マーカーの塗りつぶしを描画する際に使用するブラシを取得または設定します。
コード サンプル
// Initialize $(".selector").igBulletGraph({ targetValueBrush: "white" }); // Get var targetValueBrush = $(".selector").igBulletGraph("option", "targetValueBrush"); // Set $(".selector").igBulletGraph("option", "targetValueBrush", "white"); -
targetValueInnerExtent
- タイプ:
- number
- デフォルト:
- 0.3
0 から 1 の値でコントロールの前/下から計測される、ターゲット値の描画を開始する位置を取得または設定します。
0.5 から 1 の間の値を使用し、ブレットグラフの標準サイズを超えて拡張できます。コード サンプル
// Initialize $(".selector").igBulletGraph({ targetValueInnerExtent: 0.4 }); // Get var targetValueInnerExtent = $(".selector").igBulletGraph("option", "targetValueInnerExtent"); // Set $(".selector").igBulletGraph("option", "targetValueInnerExtent", 0.4); -
targetValueName
- タイプ:
- string
- デフォルト:
- null
ターゲット値に使用される名前を取得または設定します。名前はデフォルトのターゲット値ツールチップで表示されます。
コード サンプル
// Initialize $(".selector").igBulletGraph({ targetValueName: "myGoal" }); // Get var targetValueName = $(".selector").igBulletGraph("option", "targetValueName"); // Set $(".selector").igBulletGraph("option", "targetValueName", "myGoal"); -
targetValueOuterExtent
- タイプ:
- number
- デフォルト:
- 0.85
0 から 1 の値でコントロールの前/下から計測される、ターゲット値の描画を開始する位置を取得または設定します。
0.5 から 1 の間の値を使用し、ブレットグラフの標準サイズを超えて拡張できます。コード サンプル
// Initialize $(".selector").igBulletGraph({ targetValueOuterExtent: 0.1 }); // Get var targetValueOuterExtent = $(".selector").igBulletGraph("option", "targetValueOuterExtent"); // Set $(".selector").igBulletGraph("option", "targetValueOuterExtent", 0.1); -
targetValueOutline
- タイプ:
- string
- デフォルト:
- null
ターゲット値のアウトラインを描画する際に使用するブラシを取得または設定します。
コード サンプル
// Initialize $(".selector").igBulletGraph({ targetValueOutline: "white" }); // Get var targetValueOutline = $(".selector").igBulletGraph("option", "targetValueOutline"); // Set $(".selector").igBulletGraph("option", "targetValueOutline", "white"); -
targetValueStrokeThickness
- タイプ:
- number
- デフォルト:
- 1
ターゲット値バーのアウトラインのストローク幅を取得または設定します。
コード サンプル
// Initialize $(".selector").igBulletGraph({ targetValueStrokeThickness: 3 }); // Get var targetValueStrokeThickness = $(".selector").igBulletGraph("option", "targetValueStrokeThickness"); // Set $(".selector").igBulletGraph("option", "targetValueStrokeThickness", 3); -
targetValueToolTipTemplate
- タイプ:
- string
- デフォルト:
- null
ターゲット値のツールチップ テンプレートを取得または設定します。
コード サンプル
<script id="myTargetValueToolTipTemplateScript" type="text/x-jquery-tmpl"> <div class='ui-bulletgraph-targetValue-tooltip'> ${item.name}: ${item.value}% </div> </script> // Initialize $(".selector").igBulletGraph({ showToolTip: true, targetValueTooltipTemplate: "myTargetValueToolTipTemplateScript" }); // Get var targetValueToolTipTemplate = $(".selector").igBulletGraph("option", "targetValueToolTipTemplate"); // Set $(".selector").igBulletGraph("option", "targetValueToolTipTemplate", "myTargetValueToolTipTemplateScript"); -
tickBrush
- タイプ:
- string
- デフォルト:
- null
主目盛に使用するブラシを取得または設定します。
コード サンプル
// Initialize $(".selector").igBulletGraph({ tickBrush: "blue" }); // Get var tickBrush = $(".selector").igBulletGraph("option", "tickBrush"); // Set $(".selector").igBulletGraph("option", "tickBrush", "blue"); -
tickEndExtent
- タイプ:
- number
- デフォルト:
- 0.2
ブレットグラフの前/下から計測された、0 から 1 の値で主目盛の描画を停止する位置を取得または設定します。
0.5 から 1 の間の値を使用し、ブレットグラフの標準サイズを超えて拡張できます。コード サンプル
// Initialize $(".selector").igBulletGraph({ tickEndExtent: .5 }); // Get var tickEndExtent = $(".selector").igBulletGraph("option", "tickEndExtent"); // Set $(".selector").igBulletGraph("option", "tickEndExtent", .5); -
ticksPostInitial
- タイプ:
- number
- デフォルト:
- 0
スケールの MinimumValue に追加された、メモリの追加を開始する値。
コード サンプル
// Initialize $(".selector").igBulletGraph({ ticksPostInitial: 50 }); // Get var ticksPostInitial = $(".selector").igBulletGraph("option", "ticksPostInitial"); // Set $(".selector").igBulletGraph("option", "ticksPostInitial", 50); -
ticksPreTerminal
- タイプ:
- number
- デフォルト:
- 0
スケールの MinimumValue から差し引かれた、メモリの追加を停止する値。
コード サンプル
// Initialize $(".selector").igBulletGraph({ ticksPreTerminal: 50 }); // Get var ticksPreTerminal = $(".selector").igBulletGraph("option", "ticksPreTerminal"); // Set $(".selector").igBulletGraph("option", "ticksPreTerminal", 50); -
tickStartExtent
- タイプ:
- number
- デフォルト:
- 0.1
ブレットグラフの前/下から計測された、0 から 1 の値で主目盛の描画を開始する位置を取得または設定します。
0.5 から 1 の間の値を使用し、ブレットグラフの標準サイズを超えて拡張できます。コード サンプル
// Initialize $(".selector").igBulletGraph({ tickStartExtent: .05 }); // Get var tickStartExtent = $(".selector").igBulletGraph("option", "tickStartExtent"); // Set $(".selector").igBulletGraph("option", "tickStartExtent", .05); -
tickStrokeThickness
- タイプ:
- number
- デフォルト:
- 2
メモリを描画する際に使用するストロークの太さを取得または設定します。
コード サンプル
// Initialize $(".selector").igBulletGraph({ tickStrokeThickness: 4 }); // Get var tickStrokeThickness = $(".selector").igBulletGraph("option", "tickStrokeThickness"); // Set $(".selector").igBulletGraph("option", "tickStrokeThickness", 4); -
transitionDuration
- タイプ:
- number
- デフォルト:
- 0
ブレットグラフで変更をアニメーション化するミリ秒を数値で取得または設定します。
コード サンプル
// Initialize $(".selector").igBulletGraph({ transitionDuration: 2000 }); // Get var transitionDuration = $(".selector").igBulletGraph("option", "transitionDuration"); // Set $(".selector").igBulletGraph("option", "transitionDuration", 2000); -
value
- タイプ:
- number
- デフォルト:
- 0
バーが終了する値を取得または設定します。
コード サンプル
// Initialize $(".selector").igBulletGraph({ value: 50 }); // Get var value = $(".selector").igBulletGraph("option", "value"); // Set $(".selector").igBulletGraph("option", "value", 50); -
valueBrush
- タイプ:
- string
- デフォルト:
- null
実際の値要素に使用するブラシを取得または設定します。
コード サンプル
// Initialize $(".selector").igBulletGraph({ valueBrush: "white" }); // Get var valueBrush = $(".selector").igBulletGraph("option", "valueBrush"); // Set $(".selector").igBulletGraph("option", "valueBrush", "white"); -
valueInnerExtent
- タイプ:
- number
- デフォルト:
- 0.5
0 から 1 の値でブレット グラフの前/下から計測された、実際の値の形状を描画を開始する位置を取得または設定します。
0.5 から 1 の間の値を使用し、ブレットグラフの標準サイズを超えて拡張できます。コード サンプル
// Initialize $(".selector").igBulletGraph({ valueInnerExtent: .6 }); // Get var valueInnerExtent = $(".selector").igBulletGraph("option", "valueInnerExtent"); // Set $(".selector").igBulletGraph("option", "valueInnerExtent", .6); -
valueName
- タイプ:
- string
- デフォルト:
- null
実際値に使用される名前を取得または設定します。
コード サンプル
// Initialize $(".selector").igBulletGraph({ valueName: "myProgress" }); // Get var valueName = $(".selector").igBulletGraph("option", "valueName"); // Set $(".selector").igBulletGraph("option", "valueName", "myProgress"); -
valueOuterExtent
- タイプ:
- number
- デフォルト:
- 0.65
ブレットグラフの前/下から計測される、0 から 1 の値で実際値の形状の描画を停止する位置を取得または設定します。
0.5 から 1 の間の値を使用し、ブレットグラフの標準サイズを超えて拡張できます。コード サンプル
// Initialize $(".selector").igBulletGraph({ valueOuterExtent: .6 }); // Get var valueOuterExtent = $(".selector").igBulletGraph("option", "valueOuterExtent"); // Set $(".selector").igBulletGraph("option", "valueOuterExtent", .6); -
valueOutline
- タイプ:
- string
- デフォルト:
- null
実際の値要素のアウトラインに使用するブラシを取得または設定します。
コード サンプル
// Initialize $(".selector").igBulletGraph({ valueOutline: "white" }); // Get var valueOutline = $(".selector").igBulletGraph("option", "valueOutline"); // Set $(".selector").igBulletGraph("option", "valueOutline", "white"); -
valueStrokeThickness
- タイプ:
- number
- デフォルト:
- 1
実際の値要素を描画する際に使用するストロークの太さを取得または設定します。
コード サンプル
// Initialize $(".selector").igBulletGraph({ valueStrokeThickness: 3 }); // Get var valueStrokeThickness = $(".selector").igBulletGraph("option", "valueStrokeThickness"); // Set $(".selector").igBulletGraph("option", "valueStrokeThickness", 3); -
valueToolTipTemplate
- タイプ:
- string
- デフォルト:
- null
値のツールチップ テンプレートを取得または設定します。
コード サンプル
<script id="myValueToolTipTemplateScript" type="text/x-jquery-tmpl"> <div class='ui-bulletgraph-value-tooltip'> ${item.name} : ${item.value} </div> </script> // Initialize $(".selector").igBulletGraph({ showToolTip: true, valueTooltipTemplate: "myValueToolTipTemplateScript" }); // Get var valueToolTipTemplate = $(".selector").igBulletGraph("option", "valueToolTipTemplate"); // Set $(".selector").igBulletGraph("option", "valueToolTipTemplate", "myValueToolTipTemplateScript"); -
width
- タイプ:
- enumeration
- デフォルト:
- null
ゲージの幅。ピクセル、文字列 (px)、またはパーセンテージ (%) で数字として設定できます。
メンバー
- string
- ウィジェットの幅をピクセル (px) またはパーセンテージ (%) に設定できます。
- number
- ウィジェット幅は数値として設定できます。
コード サンプル
// Initialize
$(".selector").igBulletGraph({
    width: "400px"
});

// Get
var width = $(".selector").igBulletGraph("option", "width");

// Set
$(".selector").igBulletGraph("option", "width", "400px");
Ignite UI コントロール イベントの詳細については、
Ignite UI でイベントを使用するを参照してください。
-
alignLabel
- キャンセル可能:
- false
コード サンプル
//Bind $(document).delegate(".selector", "igbulletgraphalignlabel", function (evt, ui) { // Get reference to igBulletGraph. ui.owner; // Get the mimimum value of the bullet graph scale ui.actualMinimumValue; // Get the maximum value of the bullet graph scale ui.actualMaximumValue; // Get the value on the the bullet graph scale associated with the label. ui.value; // Get whether the string value of the label. ui.label; //Get the width of the label. ui.width; // Get the height of the label. ui.height; // Get the X offset of the label on the the bullet graph scale. ui.offsetX; // Get the Y offset of the label on the the bullet graph scale. ui.offsetY; }); // Initialize $(".selector").igBulletGraph({ alignLabel: function(evt, ui) {...} }); -
formatLabel
- キャンセル可能:
- false
コード サンプル
//Bind
$(document).delegate(".selector", "igbulletgraphformatlabel", function (evt, ui) {
    // Get reference to igBulletGraph.
    ui.owner;

    // Get the mimimum value of the bullet graph scale
    ui.actualMinimumValue;

    // Get the maximum value of the bullet graph scale
    ui.actualMaximumValue;

    // Get the value on the the bullet graph scale associated with the label.
    ui.value;

    // Get whether the string value of the label.
    ui.label;
});

// Initialize
$(".selector").igBulletGraph({
    formatLabel: function(evt, ui) {...}
});
-
addRange
- .igBulletGraph( "addRange", value:object );
新しい範囲をブレット グラフに追加します。
- value
- タイプ:object
- 追加する範囲オブジェクト。
コード サンプル
$(".selector").igBulletGraph("addRange", { name: "Range1", value: 10, endValue: 40, brush: "red" }); -
destroy
- .igBulletGraph( "destroy" );
ウィジェットを破棄します。
コード サンプル
$(".selector").igBulletGraph("destroy"); -
exportVisualData
- .igBulletGraph( "exportVisualData" );
- 返却型:
- object
- 返却型の説明:
- ビジュアル データを含む JavaScript オブジェクト。
ブレット グラフの描画方法についての情報を返します。
コード サンプル
$(".selector").igBulletGraph("exportVisualData"); -
flush
- .igBulletGraph( "flush" );
ブレット グラフの変更されたプロパティ値などのすべての保留中の変更をすぐに描画します。
コード サンプル
$(".selector").igBulletGraph("flush"); -
getRangeNames
- .igBulletGraph( "getRangeNames" );
「\n」記号で区切られたすべての範囲の名前を含む文字列を返します。
コード サンプル
$(".selector").igBulletGraph("getRangeNames"); -
removeRange
- .igBulletGraph( "removeRange", value:object );
範囲をブレット グラフから削除します。
- value
- タイプ:object
- 次のプロパティが設定される JS オブジェクト: name: nameOfTheRangeToRemove, remove: true。
コード サンプル
$(".selector").igBulletGraph("removeRange", { name: 'range1', remove: true }); -
styleUpdated
- .igBulletGraph( "styleUpdated" );
ウィジェットの CSS スタイルを再ポールします。CSS スタイルが変更されたとき、このメソッドを使用します。
コード サンプル
$(".selector").igBulletGraph("styleUpdated"); -
updateRange
- .igBulletGraph( "updateRange", value:object );
ブレット グラフの指定した範囲を更新します。
- value
- タイプ:object
- 更新する範囲オブジェクト。
コード サンプル
$(".selector").igBulletGraph("updateRange", "range1");
-
ui-bulletgraph
- メイン要素に適用されるクラス: ui-bulletGraph ui-corner-all ui-widget-content。
-
ui-bulletgraph-backing
- 背景要素に background-color および border-color を適用するクラス。
-
ui-bulletgraph-range-fill-palette-n
- ブレット グラフの n 番の範囲の塗りつぶしに background-image を適用するクラス。グラデーション色のみを設定できます。複数のパレットを定義できます。
-
ui-bulletgraph-label
- テキスト要素に background-color を適用するクラス。
-
ui-bulletgraph-minortick
- 補助目盛要素に background-color を適用するクラス。
-
ui-bulletgraph-range-outline-palette-n
- ブレット グラフの n 番の範囲のアウトラインに background-image を適用するクラス。グラデーション色のみを設定できます。複数のパレットを定義できます。
-
ui-bulletgraph-range-palette-n
- ブレット グラフの n 番の範囲に background-color および border-color を適用するクラス。複数のパレットを定義できます。
-
ui-bulletgraph-targetvalue
- ターゲット値要素に background-color および border-color を適用するクラス。
-
ui-bulletgraph-tick
- 目盛要素に background-color を適用するクラス。
-
ui-bulletgraph-value
- 値要素に background-color および border-color を適用するクラス。
-
ui-bulletgraph-tooltip ui-corner-all
- ツールチップ要素に適用されるクラス: ui-bulletgraph-tooltip ui-corner-all。
-
ui-html5-non-html5-supported-message ui-helper-clearfix ui-html5-non-html5
- bulletGraph を HTML5 と互換性のないブラウザーで開いたときに表示されるメイン要素に適用されるクラス。