
ui.igChartLegend
igChartLegend コントロールは、シリーズの名前またはチャート プロット エリアで表現されるその要素を表示する jQuery UI ウィジェットです。この API のクラス、オプション、イベント、メソッド、およびテーマの詳細は、上記の関連するタブの下に表示されます。
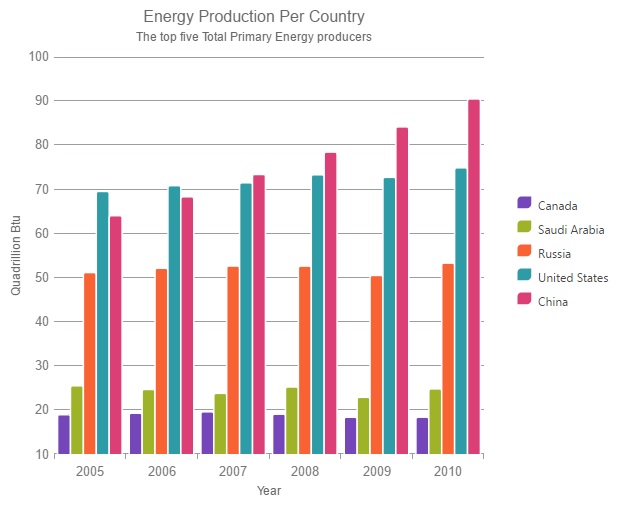
次のコード スニペットは igChartLegend コントロールの初期化方法を示しています。
igChartLegend コントロールに必要なスクリプトおよびテーマの参照方法についての詳細は、 Ignite UI での JavaScript リソースの使用および Ignite UI のスタイルとテーマの設定をお読みください。コード サンプル
<!doctype html>
<html>
<head>
    <title>Ignite UI igChartLegend</title>
    <!-- Infragistics Combined CSS -->
    <link href="css/themes/infragistics/infragistics.theme.css" rel="stylesheet" type="text/css" />
    <link href="css/structure/infragistics.css" rel="stylesheet" type="text/css" />
    <!-- jQuery Core -->
    <script src="js/jquery.js" type="text/javascript"></script>
    <!-- jQuery UI -->
    <script src="js/jquery-ui.js" type="text/javascript"></script>
    <!-- Infragistics Combined Scripts -->
    <script src="js/infragistics.core.js" type="text/javascript"></script>
	  <script src="js/infragistics.dv.js" type="text/javascript"></script>
    <script type="text/javascript" src="http://www.igniteui.com/data-files/world-energy-production.js"></script>

    <script type="text/javascript">
        $(function () {
            $("#chart").igDataChart({
                width: "500px",
                height: "500px",
                dataSource: lastFiveYears,
                title: "Energy Production Per Country",
                subtitle: "The top five Total Primary Energy producers",
                legend: { element: "legend" },
                axes: [{
                    name: "xAxis",
                    type: "categoryX",
                    label: "Year",
                    title: "Year"
                }, {
                    name: "yAxis",
                    type: "numericY",
                    title: "Quadrillion Btu"
                }],
                series: [{
                    name: "series",
                    dataSource: lastFiveYears,
                    title: "Canada",
                    type: "column",
                    xAxis: "xAxis",
                    yAxis: "yAxis",
                    valueMemberPath: "Canada",
                }, {
                    name: "series2",
                    dataSource: lastFiveYears,
                    title: "Saudi Arabia",
                    type: "column",
                    xAxis: "xAxis",
                    yAxis: "yAxis",
                    valueMemberPath: "SaudiArabia",
                }, {
                    name: "series3",
                    dataSource: lastFiveYears,
                    title: "Russia",
                    type: "column",
                    xAxis: "xAxis",
                    yAxis: "yAxis",
                    valueMemberPath: "Russia",
                }, {
                    name: "series4",
                    dataSource: lastFiveYears,
                    title: "United States",
                    type: "column",
                    xAxis: "xAxis",
                    yAxis: "yAxis",
                    valueMemberPath: "UnitedStates",
                }, {
                    name: "series5",
                    dataSource: lastFiveYears,
                    title: "China",
                    type: "column",
                    xAxis: "xAxis",
                    yAxis: "yAxis",
                    valueMemberPath: "China",
                }]
            });
        });
    </script>
</head>
<body>
    <table>
        <tr>
            <td>
                <div id="chart"></div>
            </td>
            <td>
                <div id="legend"></div>
            </td>
        </tr>
    </table>
</body>
</html>
関連サンプル
関連トピック
依存関係
-
height
- タイプ:
- enumeration
- デフォルト:
- null
凡例の高さ。ピクセル、文字列 (px)、またはパーセンテージ (%) で数字として設定できます。
コード サンプル
// Initialize $(".selector").igChartLegend({ height: "100px" }); // Get var height = $(".selector").igChartLegend("option", "height"); // Set $(".selector").igChartLegend("option", "height", "100px"); -
language
継承- タイプ:
- string
- デフォルト:
- "en"
ウィジェットのロケール言語設定を取得または設定します。
コード サンプル
//Initialize $(".selector").igChartLegend({ language: "ja" }); // Get var language = $(".selector").igChartLegend("option", "language"); // Set $(".selector").igChartLegend("option", "language", "ja"); -
locale
継承- タイプ:
- object
- デフォルト:
- null
ウィジェットのロケール設定を取得または設定します。
コード サンプル
//Initialize $(".selector").igChartLegend({ locale: {} }); // Get var locale = $(".selector").igChartLegend("option", "locale"); // Set $(".selector").igChartLegend("option", "locale", {}); -
regional
継承- タイプ:
- enumeration
- デフォルト:
- defaults
ウィジェットの領域設定を取得または設定します。
コード サンプル
//Initialize $(".selector").igChartLegend({ regional: "ja" }); // Get var regional = $(".selector").igChartLegend("option", "regional"); // Set $(".selector").igChartLegend("option", "regional", "ja"); -
theme
- タイプ:
- string
- デフォルト:
- "c"
このウィジェットをスタイルするために使用される見本。
コード サンプル
// Initialize $(".selector").igChartLegend({ theme: "metro" }); // Get var theme = $(".selector").igChartLegend("option", "theme"); -
type
- タイプ:
- enumeration
- デフォルト:
- legend
凡例のタイプ。
メンバー
- item
- タイプ:string
- 凡例を項目の凡例として指定します。igPieChart コントロール内の各パイに対して凡例の項目を表示します。
- legend
- タイプ:string
- 凡例を凡例として指定します。これは、igDataChart コントロールのすべてのタイプのシリーズによってサポートされます。
- scale
- タイプ:string
- 凡例をスケール項目の凡例として指定します。バブル シリーズの色/サイズ スケールを表示します。
コード サンプル
// Initialize $(".selector").igChartLegend({ type: "item" }); // Get var type = $(".selector").igChartLegend("option", "type"); // Set $(".selector").igChartLegend("option", "type", "item"); -
width
- タイプ:
- enumeration
- デフォルト:
- null
凡例の幅。ピクセル、文字列 (px)、またはパーセンテージ (%) で数字として設定できます。
コード サンプル
// Initialize
$(".selector").igChartLegend({
    width: "250px"
});

// Get
var width = $(".selector").igChartLegend("option", "width");

// Set
$(".selector").igChartLegend("option", "width", "250px");
Ignite UI コントロール イベントの詳細については、
Ignite UI でイベントを使用するを参照してください。
-
legendItemMouseEnter
- キャンセル可能:
- false
マウス ポインターがこの凡例の要素に入ったときに発生します。
関数は引数 evt および ui を受け取ります。
現在の凡例オブジェクトへの参照を取得するには ui.legend を使用します。
チャート オーナー オブジェクトへの参照を取得するには ui.chart を使用します。
現在のシリーズ オーナー オブジェクトへの参照を取得するには ui.series を使用します。
凡例の項目ブラシを取得するには ui.actualItemBrush を使用します。
シリーズ オーナー ブラシを取得するには ui.actualSeriesBrush を使用します。
イベントに関連するチャート項目への参照を取得するために ui.item を使用します。コード サンプル
// Delegate $(document).delegate(".selector", "igchartlegendlegenditemmouseenter", function (evt, ui) { // Get reference to the current legend object. ui.legend; // Get reference to the chart owner object. ui.chart; // Get reference to tge current series owner object. ui.series; // Get legend item brush. ui.actualItemBrush; // Get series owner brush. ui.actualSeriesBrush; }); // Initialize $(".selector").igChartLegend({ legendItemMouseEnter: function (evt, ui) { } }); -
legendItemMouseLeave
- キャンセル可能:
- false
マウス ポインターがこの凡例の要素から出たときに発生します。
関数は引数 evt および ui を受け取ります。
現在の凡例オブジェクトへの参照を取得するには ui.legend を使用します。
チャート オーナー オブジェクトへの参照を取得するには ui.chart を使用します。
現在のシリーズ オーナー オブジェクトへの参照を取得するには ui.series を使用します。
凡例の項目ブラシを取得するには ui.actualItemBrush を使用します。
シリーズ オーナー ブラシを取得するには ui.actualSeriesBrush を使用します。
イベントに関連するチャート項目への参照を取得するために ui.item を使用します。コード サンプル
// Delegate $(document).delegate(".selector", "igchartlegendlegenditemmouseleave", function (evt, ui) { // Get reference to the current legend object. ui.legend; // Get reference to the chart owner object. ui.chart; // Get reference to tge current series owner object. ui.series; // Get legend item brush. ui.actualItemBrush; // Get series owner brush. ui.actualSeriesBrush; }); // Initialize $(".selector").igChartLegend({ legendItemMouseLeave: function (evt, ui) { } }); -
legendItemMouseLeftButtonDown
- キャンセル可能:
- false
マウス ポインターがこの凡例の要素の上にある間に左のマウス ボタンが押されると発生します。
関数は引数 evt および ui を受け取ります。
現在の凡例オブジェクトへの参照を取得するには ui.legend を使用します。
チャート オーナー オブジェクトへの参照を取得するには ui.chart を使用します。
現在のシリーズ オーナー オブジェクトへの参照を取得するには ui.series を使用します。
凡例の項目ブラシを取得するには ui.actualItemBrush を使用します。
シリーズ オーナー ブラシを取得するには ui.actualSeriesBrush を使用します。
イベントに関連するチャート項目への参照を取得するために ui.item を使用します。コード サンプル
// Delegate $(document).delegate(".selector", "igchartlegendlegenditemmouseleftbuttondown", function (evt, ui) { // Get reference to the current legend object. ui.legend; // Get reference to the chart owner object. ui.chart; // Get reference to tge current series owner object. ui.series; // Get legend item brush. ui.actualItemBrush; // Get series owner brush. ui.actualSeriesBrush; }); // Initialize $(".selector").igChartLegend({ legendItemMouseLeftButtonDown: function (evt, ui) { } }); -
legendItemMouseLeftButtonUp
- キャンセル可能:
- false
マウス ポインターがこの凡例の要素の上にある間に左のマウス ボタンが離されると発生します。
関数は引数 evt および ui を受け取ります。
現在の凡例オブジェクトへの参照を取得するには ui.legend を使用します。
チャート オーナー オブジェクトへの参照を取得するには ui.chart を使用します。
現在のシリーズ オーナー オブジェクトへの参照を取得するには ui.series を使用します。
凡例の項目ブラシを取得するには ui.actualItemBrush を使用します。
シリーズ オーナー ブラシを取得するには ui.actualSeriesBrush を使用します。
イベントに関連するチャート項目への参照を取得するために ui.item を使用します。コード サンプル
// Delegate
$(document).delegate(".selector", "igchartlegendlegenditemmouseleftbuttonup", function (evt, ui) {
    // Get reference to the current legend object.
    ui.legend;

    // Get reference to the chart owner object.
    ui.chart;

    // Get reference to tge current series owner object.
    ui.series;

    // Get legend item brush.
    ui.actualItemBrush;

    // Get series owner brush.
    ui.actualSeriesBrush;
});

// Initialize
$(".selector").igChartLegend({
    legendItemMouseLeftButtonUp: function (evt, ui) {

    }
});
-
changeGlobalLanguage
継承- .igChartLegend( "changeGlobalLanguage" );
ウィジェットの言語をグローバルの言語に変更します。グローバルの言語は $.ig.util.language の値です。
コード サンプル
$(".selector").igChartLegend("changeGlobalLanguage"); -
changeGlobalRegional
継承- .igChartLegend( "changeGlobalRegional" );
ウィジェットの地域設定をグローバルの地域設定に変更します。グローバルの地域設定は $.ig.util.regional にあります。
コード サンプル
$(".selector").igChartLegend("changeGlobalRegional"); -
changeLocale
継承- .igChartLegend( "changeLocale", $container:object );
指定したコンテナーに含まれるすべてのロケールを options.language で指定した言語に変更します。
注: このメソッドは珍しいシナリオのみで使用されます。language または locale オプションのセッターを参照してください。- $container
- タイプ:object
- オプションのパラメーター: 設定しない場合、ウィジェットの要素を $container として使用します。
コード サンプル
$(".selector").igChartLegend("changeLocale"); -
destroy
- .igChartLegend( "destroy" );
ウィジェットを破棄します。
コード サンプル
$(".selector").igChartLegend("destroy"); -
exportVisualData
- .igChartLegend( "exportVisualData" );
コード サンプル
var visualData = $(".selector").igChartLegend("exportVisualData"); -
id
- .igChartLegend( "id" );
- 返却型:
- string
凡例を含む DOM 要素の ID を返します。
コード サンプル
var parentDivId = $(".selector").igChartLegend("id"); -
widget
- .igChartLegend( "widget" );
凡例を含む要素を返します。
コード サンプル
var parentDiv = $(".selector").igChartLegend("widget");
-
ui-corner-all ui-widget-content ui-chart-legend
- 親要素に適用されるクラス。
-
ui-chart-legend-item
- 凡例項目の tr 要素に適用されるクラス。
-
ui-chart-legend-item-badge
- 凡例項目印の td 要素に適用されるクラス。
-
ui-chart-legend-items-list
- 凡例項目の table 要素に適用されるクラス。
-
ui-chart-legend-item-text
- 凡例項目印の td 要素に適用されるクラス。