
ui.igPieChart
igPieChart コントロールは HTML 5 jQuery チャートです。この API のクラス、オプション、イベント、メソッド、およびテーマの詳細は、上記の関連するタブの下に表示されます。
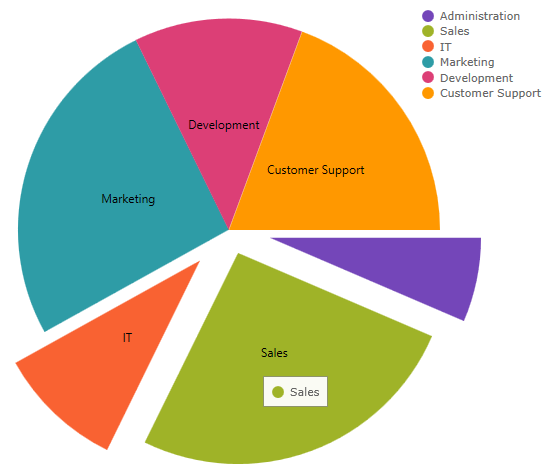
次のコード スニペットは igPieChart コントロールの初期化方法を示しています。
igPieChart コントロールに必要なスクリプトおよびテーマの参照方法についての詳細は、 Ignite UI での JavaScript リソースの使用および Ignite UI のスタイルとテーマの設定をお読みください。コード サンプル
<!doctype html>
<html>
<head>
    <title>Ignite UI igPieChart</title>
    <!-- Infragistics Combined CSS -->
    <link href="css/themes/infragistics/infragistics.theme.css" rel="stylesheet" type="text/css" />
    <link href="css/structure/infragistics.css" rel="stylesheet" type="text/css" />
    <!-- jQuery Core -->
    <script src="js/jquery.js" type="text/javascript"></script>
    <!-- jQuery UI -->
    <script src="js/jquery-ui.js" type="text/javascript"></script>
    <!-- Infragistics Combined Scripts -->
    <script src="js/infragistics.core.js" type="text/javascript"></script>
    <script src="js/infragistics.dv.js" type="text/javascript"></script>

    <script type="text/javascript">
        $(function () {
            var data = [
                    { "Budget": 60, "Label": "Administration" },
                    { "Budget": 40, "Label": "Sales" },
                    { "Budget": 60, "Label": "IT" },
                    { "Budget": 40, "Label": "Marketing" },
                    { "Budget": 60, "Label": "Development" },
                    { "Budget": 20, "Label": "Support" }
                ];

            $("#chart").igPieChart({
                dataSource: data,
                width: "500px",
                height: "500px",
                dataValue: "Budget",
                dataLabel: "Label",
                explodedSlices: "0 1",
                radiusFactor: .8,
                legend: {
                    element: "legend",
                    type: "item"
                }
            });
        });
    </script>
</head>
<body>
    <div id="chart"></div>
	<div id="legend"></div>
</body>
</html>
関連サンプル
関連トピック
依存関係
-
allowSliceExplosion
- タイプ:
- bool
- デフォルト:
- true
スライスを展開できるかどうかを取得または設定します。
コード サンプル
//Initialize $(".selector").igPieChart({ allowSliceExplosion : true }); //Get var allowSliceExplosion = $(".selector").igPieChart("option", "allowSliceExplosion"); //Set $(".selector").igPieChart("option", "allowSliceExplosion", true); -
allowSliceSelection
- タイプ:
- bool
- デフォルト:
- true
スライスを選択できるかどうかを取得または設定します。
コード サンプル
//Initialize $(".selector").igPieChart({ allowSliceSelection : true }); //Get var allowSliceSelection = $(".selector").igPieChart("option", "allowSliceSelection"); //Set $(".selector").igPieChart("option", "allowSliceSelection", true); -
brushes
- タイプ:
- object
- デフォルト:
- null
Brushes プロパティを取得または設定します。
ブラシ プロパティは自動的に割り当てられるブラシを選択するパレットを定義します。
提供された値は、css 色文字列の配列である必要があります。最初の要素は、コレクションの補間モードを指定する RGB または HSV の文字列に設定するオプションがあります。コード サンプル
//Initialize $(".selector").igPieChart({ brushes: [ "#ff0000", "#ffff00", "#00ffff" ] }); //Get var brushes = $(".selector").igPieChart("option", "brushes"); //Set $(".selector").igPieChart("option", "brushes", [ "#ff0000", "#ffff00", "#00ffff" ]); -
dataLabel
- タイプ:
- string
- デフォルト:
- null
ラベルを含むプロパティ名を取得または設定します。
コード サンプル
// Given this data... var data1 = [ { "Department": "Accounting", "Cost": 12.5 }, { "Department": "Marketing", "Cost": 18.56 }, { "Department": "R&D", "Cost": 22.18 } ]; // Initialize $(".selector").igPieChart({ dataLabel: "Department" }); // Get var dataLabel = $(".selector").igPieChart("option", "dataLabel"); // Set $(".selector").igPieChart("option", "dataLabel", "Department"); -
dataSource
- タイプ:
- object
- デフォルト:
- null
$.ig.DataSource が受け入れる有効なデータ ソースまたは $.ig.DataSource 自体のインスタンスが可能です。
コード サンプル
//Initialize var data1 = [ { "ID": 1, "Cost": 12.5 }, { "ID": 2, "Cost": 18.56 }, { "ID": 3, "Cost": 22.18 } ]; $(".selector").igPieChart({ dataSource: data1 }); //Get var dataSource = $(".selector").igPieChart("option", "dataSource"); //Set var data1 = [ { "ID": 1, "Cost": 12.5 }, { "ID": 2, "Cost": 18.56 }, { "ID": 3, "Cost": 22.18 } ]; $(".selector").igPieChart("option", "dataSource", data1); -
dataSourceType
- タイプ:
- string
- デフォルト:
- null
データ ソースのタイプ ("json" など) を明示的に設定します。$.ig.DataSource とそのタイプ プロパティのドキュメントを参照してください。
コード サンプル
//Initialize $(".selector").igPieChart({ dataSourceType: "array" }); //Get var dataSourceType = $(".selector").igPieChart("option", "dataSourceType"); //Set $(".selector").igPieChart("option", "dataSourceType", "array"); -
dataSourceUrl
- タイプ:
- string
- デフォルト:
- null
$.ig.DataSource からデータを要求するには、$.ig.DataSource により承諾されたリモート URL を指定します。
コード サンプル
//Initialize $(".selector").igPieChart({ dataSourceUrl: "http://www.example.com" }); //Get var dataSourceUrl = $(".selector").igPieChart("option", "dataSourceUrl"); //Set $(".selector").igPieChart("option", "dataSourceUrl", "http://www.example.com"); -
dataValue
- タイプ:
- string
- デフォルト:
- null
値を含むプロパティ名を取得または設定します。
コード サンプル
// Given this data... var data1 = [ { "Department": "Accounting", "Cost": 12.5 }, { "Department": "Marketing", "Cost": 18.56 }, { "Department": "R&D", "Cost": 22.18 } ]; // Initialize $(".selector").igPieChart({ dataValue: "Cost" }); // Get var dataValue = $(".selector").igPieChart("option", "dataValue"); // Set $(".selector").igPieChart("option", "dataValue", "Cost"); -
explodedRadius
- タイプ:
- number
- デフォルト:
- 0.2
展開されたスライスが中央からオフセットされる量を決定します。0 と 1 の間の値。
コード サンプル
//Initialize $(".selector").igPieChart({ explodedRadius: 0.35 }); //Get var explodedRadius = $(".selector").igPieChart("option", "explodedRadius"); //Set $(".selector").igPieChart("option", "explodedRadius", 0.35); -
explodedSlices
- タイプ:
- array
- デフォルト:
- null
- 要素タイプ:
展開したスライスのインデックスのコレクションを取得または設定します。
展開するスライスのインデックスを示す整数の配列です。コード サンプル
// Initialize $(".selector").igPieChart({ explodedSlices: [0, 1, 5] }); // Get var explodedSlices = $(".selector").igPieChart("option", "explodedSlices"); // Set $(".selector").igPieChart("option", "explodedSlices", [0, 1, 5]); -
formatLabel
- タイプ:
- function
- デフォルト:
- null
円スライスのデータ コンテキストをスライスのラベルに変換するために使用される関数を取得または設定します。関数は object 型の 1 つの引数を受けます。
context.item を使用して、スライスと関連する項目を取得します。
context.outline を使用して、スライスを描画するために使用されたアウトライン ブラシを取得します。
context.itemLabel を使用して、スライスで使用されるラベル オブジェクトを取得します。
context.percentValue を使用して、スライスと関連するパーセント値を取得します。
context.isOthersSlice を使用して、関連するスライスは「その他」のスライスかどうかを取得します。
ラベルで使用する文字列値を返します。コード サンプル
// Initialize $(".selector").igPieChart({ formatLabel: function (context) { ... } }); -
height
- タイプ:
- enumeration
- デフォルト:
- null
チャートの高さ。ピクセル、文字列 (px)、またはパーセンテージ (%) で数字として設定できます。
メンバー
- string
- ウィジェットの高さはピクセル (px) およびパーセント (%) で設定できます (%)。
- number
- ウィジェットの高さは数値として設定できます。
コード サンプル
// Initialize $(".selector").igPieChart({ height: 250 }); // Get var height = $(".selector").igPieChart("option", "height"); // Set $(".selector").igPieChart("option", "height", 250); -
labelExtent
- タイプ:
- number
- デフォルト:
- 10
スライスの端からラベルをオフセットするピクセル量を取得または設定します。
コード サンプル
//Initialize $(".selector").igPieChart({ labelExtent: 15 }); //Get var labelExtent = $(".selector").igPieChart("option", "labelExtent"); //Set $(".selector").igPieChart("option", "labelExtent", 15); -
labelInnerColor
- タイプ:
- string
- デフォルト:
- null
円チャート内に描画されるラベルの色を取得または設定します。色が設定されない場合、チャートは CSS で色を検索します。色が設定されない場合、デフォルト色を使用します。
コード サンプル
// Initialize $(".selector").igPieChart({ labelInnerColor: "white" }); // Get var labelInnerColor = $(".selector").igPieChart("option", "labelInnerColor"); // Set $(".selector").igPieChart("option", "labelInnerColor", "white"); -
labelMemberPath
非推奨- タイプ:
- string
- デフォルト:
- null
ラベルを含むプロパティ名を取得または設定します。
コード サンプル
//Initialize var data = [ { "Department": "Accounting", "Cost": 12.5 }, { "Department": "Marketing", "Cost": 18.56 }, { "Department": "R&D", "Cost": 22.18 } ]; $(".selector").igPieChart({ labelMemberPath: "Department" }); //Get var opValue = $(".selector").igPieChart("option", "labelMemberPath"); //Set $(".selector").igPieChart("option", "labelMemberPath", "Department"); -
labelOuterColor
- タイプ:
- string
- デフォルト:
- null
円チャートの外に描画されるラベルの色を取得または設定します。色が設定されない場合、チャートは CSS で色を検索します。色が設定されない場合、デフォルト色を使用します。
コード サンプル
// Initialize $(".selector").igPieChart({ labelOuterColor: "black" }); // Get var labelOuterColor = $(".selector").igPieChart("option", "labelOuterColor"); // Set $(".selector").igPieChart("option", "labelOuterColor", "black"); -
labelsPosition
- タイプ:
- enumeration
- デフォルト:
- center
チャート ラベルの位置を取得または設定します。
メンバー
- none
- タイプ:string
- ラベルは表示されません。
- center
- タイプ:string
- ラベルは中央に表示されます。
- insideEnd
- タイプ:string
- ラベルはコンテナーの内側と端の近くに表示されます。
- outsideEnd
- タイプ:string
- ラベルはコンテナーの外に表示されます。
- bestFit
- タイプ:string
- ラベルの場所は自動的に決まります。
コード サンプル
//Initialize $(".selector").igPieChart({ labelsPosition: "bestFit" }); //Get var opValue = $(".selector").igPieChart("option", "labelsPosition"); //Set $(".selector").igPieChart("option", "labelsPosition", "bestFit"); -
language
継承- タイプ:
- string
- デフォルト:
- "en"
ウィジェットのロケール言語設定を取得または設定します。
コード サンプル
//Initialize $(".selector").igPieChart({ language: "ja" }); // Get var language = $(".selector").igPieChart("option", "language"); // Set $(".selector").igPieChart("option", "language", "ja"); -
leaderLineMargin
- タイプ:
- number
- デフォルト:
- 6.0
ラベルおよびその引き出し線の終了の間のマージンを取得または設定します。
コード サンプル
//Initialize $(".selector").igPieChart({ leaderLineMargin: 3 }); //Get var leaderLineMargin = $(".selector").igPieChart("option", "leaderLineMargin"); //Set $(".selector").igPieChart("option", "leaderLineMargin", 3); -
leaderLineType
- タイプ:
- enumeration
- デフォルト:
- straight
外側の終了ラベルに使用されるリーダー線のタイプを取得または設定します。
メンバー
- straight
- タイプ:string
- arc
- タイプ:string
- spline
- タイプ:string
コード サンプル
//Initialize $(".selector").igPieChart({ leaderLineType: "arc" }); //Get var leaderLineType = $(".selector").igPieChart("option", "leaderLineType"); //Set $(".selector").igPieChart("option", "leaderLineType", "arc"); -
leaderLineVisibility
- タイプ:
- enumeration
- デフォルト:
- visible
引き出し線が表示されるかどうかを取得または設定します。
メンバー
- visible
- タイプ:string
- collapsed
- タイプ:string
コード サンプル
//Initialize $(".selector").igPieChart({ leaderLineVisibility: "collapsed" }); //Get var opValue = $(".selector").igPieChart("option", "leaderLineVisibility"); //Set $(".selector").igPieChart("option", "leaderLineVisibility", "collapsed"); -
legend
- タイプ:
- object
- デフォルト:
- {}
$.ig.ChartLegend が受け入れる有効なオプションまたは $.ig.ChartLegend 自体のインスタンスが可能です。
コード サンプル
//Initialize $(".selector").igPieChart({ legend: { element: 'legend', type: 'item' } }); //Get var legend = $(".selector").igPieChart("option", "legend");-
element
- タイプ:
- string
- デフォルト:
- null
凡例に変更する要素の名前。
コード サンプル
//Initialize $(".selector").igPieChart({ legend: { element: "legend", type: "item" } }); //Get var legend = $(".selector").igPieChart("option", "legend"); // Get legend element on page legend.element; -
height
- タイプ:
- number
- デフォルト:
- null
凡例の高さ。ピクセル、文字列 (px)、またはパーセンテージ (%) で数字として設定できます。
コード サンプル
//Initialize $(".selector").igPieChart({ legend: { element: "legend", type: "item", height: "100px" } }); //Get var legend = $(".selector").igPieChart("option", "legend"); // Get legend height legend.height; -
type
- タイプ:
- enumeration
- デフォルト:
- item
凡例のタイプ。
メンバー
- item
- タイプ:string
- 凡例を項目の凡例として指定します。igPieChart コントロール内の各パイに対して凡例の項目を表示します。
- legend
- タイプ:string
- 凡例を凡例として指定します。これは、igDataChart コントロールのすべてのタイプのシリーズによってサポートされます。
コード サンプル
//Initialize $(".selector").igPieChart({ legend: { element: "legend", type: "item" } }); //Get var legend = $(".selector").igPieChart("option", "legend"); // Get legend type legend.type; -
width
- タイプ:
- number
- デフォルト:
- null
凡例の幅。ピクセル、文字列 (px)、またはパーセンテージ (%) で数字として設定できます。
コード サンプル
//Initialize
$(".selector").igPieChart({
  legend: { element: "legend", type: "item", width: "100px" }
});

//Get
var legend = $(".selector").igPieChart("option", "legend");
//  Get legend width
legend.width;
-
legendItemBadgeTemplate
- タイプ:
- object
- デフォルト:
- null
LegendItemBadgeTemplate プロパティを取得または設定します。
凡例項目バッジは、LegendItemBadgeTemplate に従って、シリーズ オブジェクト自身によってオンデマンドで作成されます。
チャート オブジェクト自体。
提供されるオブジェクトには、描画とオプションでメジャーと呼ばれるプロパティがあります。option: legendItemBadgeTemplate の定義を参照してください。コード サンプル
//Initialize $(".selector").igPieChart({ legendItemBadgeTemplate: { measure: function(measureInfo) { measureInfo.context; // either a DOM element or a CanvasContext2D depending on the particular template scenario measureInfo.width; // if value is present, specifies the available width, user may set to desired width for content measureInfo.height; // if value is present, specifies the available height, user may set to desired height for content measureInfo.isConstant; // user should set to true if desired with and height will always be the same for this template measureInfo.data; // if present, represents the contextual data for this template] }, render: function (renderInfo) { measureInfo.context; // either a DOM element or a CanvasContext2D depending on the particular template scenario measureInfo.xPosition; // if present, specifies the x position at which to render the content measureInfo.yPosition; // if present, specifies the y position at which to render the content measureInfo.availableWidth; // if present, specifies the available width in which to render the content measureInfo.availableHeight; // if present, specifies the available height in which to render the content measureInfo.data; // if present, specifies the data that is in context for this content measureInfo.isHitTestRender; // if true, indicates that this is a special render pass for hit testing, in which case the brushes from the data should be used } } }); -
legendItemTemplate
- タイプ:
- object
- デフォルト:
- null
LegendItemTemplate プロパティを取得または設定します。
凡例項目コントロール コンテンツは、LegendItemTemplate に従って、シリーズ オブジェクト自身によってオンデマンドで作成されます。
チャート オブジェクト自体。
提供されるオブジェクトには、描画とオプションでメジャーと呼ばれるプロパティがあります。option: legendItemBadgeTemplate の定義を参照してください。コード サンプル
//Initialize $(".selector").igPieChart({ legendItemTemplate: { measure: function(measureInfo) { measureInfo.context; // either a DOM element or a CanvasContext2D depending on the particular template scenario measureInfo.width; // if value is present, specifies the available width, user may set to desired width for content measureInfo.height; // if value is present, specifies the available height, user may set to desired height for content measureInfo.isConstant; // user should set to true if desired with and height will always be the same for this template measureInfo.data; // if present, represents the contextual data for this template] }, render: function (renderInfo) { measureInfo.context; // either a DOM element or a CanvasContext2D depending on the particular template scenario measureInfo.xPosition; // if present, specifies the x position at which to render the content measureInfo.yPosition; // if present, specifies the y position at which to render the content measureInfo.availableWidth; // if present, specifies the available width in which to render the content measureInfo.availableHeight; // if present, specifies the available height in which to render the content measureInfo.data; // if present, specifies the data that is in context for this content measureInfo.isHitTestRender; // if true, indicates that this is a special render pass for hit testing, in which case the brushes from the data should be used } } }); -
legendLabelMemberPath
- タイプ:
- string
- デフォルト:
- null
凡例ラベルを含むプロパティ名を取得または設定します。
-
locale
継承- タイプ:
- object
- デフォルト:
- null
ウィジェットのロケール設定を取得または設定します。
コード サンプル
//Initialize $(".selector").igPieChart({ locale: {} }); // Get var locale = $(".selector").igPieChart("option", "locale"); // Set $(".selector").igPieChart("option", "locale", {}); -
othersCategoryStyle
- タイプ:
- object
- デフォルト:
- null
「その他」のカテゴリ スライスでスタイル設定をオーバーライドするために使用されるスタイル オブジェクトを取得または設定します。
コード サンプル
// Given the following style... var style = { fill: "red", stroke: "black", strokeThickness: 3, opacity: 0 }; // Initialize $(".selector").igPieChart({ othersCategoryStyle: style }); // Get var othersCategoryStyle = $(".selector").igPieChart("option", "othersCategoryStyle"); // Set $(".selector").igPieChart("option", "othersCategoryStyle", style); -
othersCategoryText
- タイプ:
- string
- デフォルト:
- "Others"
その他のスライスのラベルを取得または設定します。
コード サンプル
//Initialize $(".selector").igPieChart({ othersCategoryText: "Other Countries" }); //Get var opValue = $(".selector").igPieChart("option", "othersCategoryText"); //Set $(".selector").igPieChart("option", "othersCategoryText", "Other Countries"); -
othersCategoryThreshold
- タイプ:
- number
- デフォルト:
- 3
スライスがその他のスライスにグループ化されるかを決定するしきい値を取得または設定します。
コード サンプル
//Initialize $(".selector").igPieChart({ othersCategoryThreshold: 8 }); //Get var opValue = $(".selector").igPieChart("option", "othersCategoryThreshold"); //Set $(".selector").igPieChart("option", "othersCategoryThreshold", 8); -
othersCategoryType
- タイプ:
- enumeration
- デフォルト:
- percent
数値ベースのしきい値を使用するかパーセント ベースのしきい値を使用するかを取得または設定します。
メンバー
- number
- タイプ:string
- データ値は OthersCategoryThreshold の値と直接比較されます。
- percent
- タイプ:string
- データ値は合計のパーセンテージとして OthersCategoryThreshold と比較されます。
コード サンプル
//Initialize $(".selector").igPieChart({ othersCategoryType: "percent" }); //Get var opValue = $(".selector").igPieChart("option", "othersCategoryType"); //Set $(".selector").igPieChart("option", "othersCategoryType", "percent"); -
outlines
- タイプ:
- object
- デフォルト:
- null
Outlines プロパティを取得または設定します。
Outlines プロパティは自動的に割り当てられるスライス アウトラインを選択するパレットを定義します。
提供された値は、css 色文字列の配列である必要があります。最初の要素は、コレクションの補間モードを指定する RGB または HSV の文字列に設定するオプションがあります。コード サンプル
//Initialize $(".selector").igPieChart({ outlines: [ "#ff0000", "#ffff00", "#00ffff" ] }); //Get var opValue = $(".selector").igPieChart("option", "outlines"); //Set $(".selector").igPieChart("option", "outlines", [ "#ff0000", "#ffff00", "#00ffff" ]); -
radiusFactor
- タイプ:
- number
- デフォルト:
- 0.9
チャートの半径のスケール率を取得または設定します。0 と 1 の間の値。
コード サンプル
//Initialize $(".selector").igPieChart({ radiusFactor: 0.75 }); //Get var opValue = $(".selector").igPieChart("option", "radiusFactor"); //Set $(".selector").igPieChart("option", "radiusFactor", 0.75); -
regional
継承- タイプ:
- enumeration
- デフォルト:
- defaults
ウィジェットの領域設定を取得または設定します。
コード サンプル
//Initialize $(".selector").igPieChart({ regional: "ja" }); // Get var regional = $(".selector").igPieChart("option", "regional"); // Set $(".selector").igPieChart("option", "regional", "ja"); -
responseDataKey
- タイプ:
- string
- デフォルト:
- null
$.ig.DataSource を参照してください。応答がラップされる場合に、データ レコードが保持されるプロパティの名前を指定します。
コード サンプル
//Initialize $(".selector").igPieChart({ responseDataKey: "Records" }); //Get var responseDataKey = $(".selector").igPieChart("option", "responseDataKey"); -
selectedItem
- タイプ:
- object
- デフォルト:
- null
現在選択しているデータ項目を取得または設定します。異なるデータ項目が提供される場合、円チャートは新しい項目と関連づけされたスライスを選択します。
コード サンプル
// Initialize $(".selector").igPieChart({ selectedItem: dataItem1 }); // Get var selectedItem = $(".selector").igPieChart("option", "selectedItem"); // Set $(".selector").igPieChart("option", "selectedItem", dataItem1); -
selectedItems
- タイプ:
- array
- デフォルト:
- null
- 要素タイプ:
現在選択しているデータ項目を取得または設定します。この配列からデータ項目を追加または削除すると、その項目に関連付けられたスライスを選択または選択解除します。
コード サンプル
// Initialize $(".selector").igPieChart({ selectedItems: [dataItem1, dataItem2, dataItem3] }); // Get var selectedItems = $(".selector").igPieChart("option", "selectedItems"); // Set $(".selector").igPieChart("option", "selectedItems", [dataItem1, dataItem2, dataItem3]); -
selectedSlices
- タイプ:
- array
- デフォルト:
- null
- 要素タイプ:
選択したスライスのインデックスのコレクションを設定します。
選択するスライスのインデックスを示す整数の配列です。コード サンプル
// Initialize $(".selector").igPieChart({ selectedSlices: [0, 1, 5] }); // Get var selectedSlices = $(".selector").igPieChart("option", "selectedSlices"); // Set $(".selector").igPieChart("option", "selectedSlices", [0, 1, 5]); -
selectedStyle
- タイプ:
- object
- デフォルト:
- null
スライスを選択するときに使用するスタイルを取得または設定します。
コード サンプル
// Given the following style... var style = { fill: "red", stroke: "black", strokeThickness: 3, opacity: 0 }; // Initialize $(".selector").igPieChart({ selectedStyle: style }); // Get var selectedStyle = $(".selector").igPieChart("option", "selectedStyle"); // Set $(".selector").igPieChart("option", "selectedStyle", style); -
selectionMode
- タイプ:
- enumeration
- デフォルト:
- single
円チャートの許可される選択タイプを取得または設定します。
メンバー
- single
- タイプ:string
- 単一のスライスを選択できます。
- multiple
- タイプ:string
- 複数のスライスを選択できます。
- manual
- タイプ:string
- スライスをコードでのみ選択できます。
コード サンプル
// Initialize $(".selector").igPieChart({ selectionMode: "multiple" }); // Get var mode = $(".selector").igPieChart("option", "selectionMode"); // Set $(".selector").igPieChart("option", "selectionMode", "multiple"); -
showTooltip
- タイプ:
- bool
- デフォルト:
- false
チャートがツールチップを描画すべきかどうか。
コード サンプル
// Initialize $(".selector").igPieChart({ showTooltip: true }); // Get var showTooltip = $(".selector").igPieChart("option", "showTooltip"); // Set $(".selector").igPieChart("option", "showTooltip", true); -
startAngle
- タイプ:
- number
- デフォルト:
- 0
チャートの開始角度を取得または設定します。
デフォルト値 0 は、時計の 3 時に相当します。コード サンプル
//Initialize $(".selector").igPieChart({ startAngle: 3 }); //Get var opValue = $(".selector").igPieChart("option", "startAngle"); //Set $(".selector").igPieChart("option", "startAngle", 3); -
sweepDirection
- タイプ:
- enumeration
- デフォルト:
- clockwise
チャートの回転方向を取得または設定します。
メンバー
- counterclockwise
- タイプ:string
- clockwise
- タイプ:string
コード サンプル
//Initialize $(".selector").igPieChart({ sweepDirection: "counterclockwise" }); //Get var opValue = $(".selector").igPieChart("option", "sweepDirection"); //Set $(".selector").igPieChart("option", "sweepDirection", "counterclockwise"); -
textStyle
- タイプ:
- string
- デフォルト:
- null
円チャートのテキストのスタイル設定をオーバーライドします。
コード サンプル
//Initialize $(".selector").igPieChart({ textStyle: "pieLabel" }); //Get var opValue = $(".selector").igPieChart("option", "textStyle"); //Set $(".selector").igPieChart("option", "textStyle", "pieLabel"); -
theme
- タイプ:
- string
- デフォルト:
- "c"
このウィジェットをスタイルするために使用される見本。
コード サンプル
//Initialize $(".selector").igPieChart({ theme: "metro" }); //Get var theme = $(".selector").igPieChart("option", "theme"); -
tooltipTemplate
- タイプ:
- string
- デフォルト:
- null
チャート ツールチップが描画するために使用するテンプレートの名前またはテンプレート。
コード サンプル
//Initialize $(".selector").igPieChart({ tooltipTemplate: "salesTooltip" }); //Get var tooltipTemplate = $(".selector").igPieChart("option", "tooltipTemplate"); //Set $(".selector").igPieChart("option", "tooltipTemplate", "salesTooltip"); -
valueMemberPath
非推奨- タイプ:
- string
- デフォルト:
- null
値を含むプロパティ名を取得または設定します。このオプションは非推奨です。`dataValue` オプションを使用してください。
コード サンプル
//Initialize var data1 = [ { "Department": "Accounting", "Cost": 12.5 }, { "Department": "Marketing", "Cost": 18.56 }, { "Department": "R&D", "Cost": 22.18 } ]; $(".selector").igPieChart({ valueMemberPath: "Cost" }); //Get var opValue = $(".selector").igPieChart("option", "valueMemberPath"); //Set var data1 = [ { "Department": "Accounting", "Cost": 12.5 }, { "Department": "Marketing", "Cost": 18.56 }, { "Department": "R&D", "Cost": 22.18 } ]; $(".selector").igPieChart("option", "valueMemberPath", "Cost"); -
width
- タイプ:
- enumeration
- デフォルト:
- null
チャートの幅。ピクセル、文字列 (px)、またはパーセンテージ (%) で数字として設定できます。
メンバー
- string
- ウィジェットの幅をピクセル (px) またはパーセンテージ (%) に設定できます。
- number
- ウィジェット幅は数値として設定できます。
コード サンプル
//Initialize
$(".selector").igPieChart({
  width: 250
});

//Get
var opValue = $(".selector").igPieChart("option", "width");
Ignite UI コントロール イベントの詳細については、
Ignite UI でイベントを使用するを参照してください。
-
browserNotSupported
- キャンセル可能:
- false
HTML5 非互換のブラウザでコントロールを表示したときに発生するイベント。
コード サンプル
// Bind $(document).delegate(".selector", "igpiechartbrowsernotsupported", function () { }); //Initialize $(".selector").igPieChart({ browserNotSupported: function () { ... } }); -
labelClick
- キャンセル可能:
- false
スライスのラベルがクリックされたときに発生します。
関数は引数 evt および ui を受け取ります。
スライス オブジェクトへの参照を取得するには ui.item を使用します。
ui.allowSliceClick を使用すると、ラベルのクリックがスライスの click イベントを発生するかどうかを決定します。コード サンプル
// Bind $(document).delegate(".selector", "igpiechartlabelclick", function (evt, ui) { // Use ui.item to get reference to the slice object. ui.item; // Use ui.allowSliceClick to determine whether or not the label click should fire slice click event. ui.allowSliceClick; }); // Initialize $(".selector").igPieChart({ labelClick: function (evt, ui) { ... } }); -
selectedItemChanged
- キャンセル可能:
- false
selectedItem オプションが変更したときに発生するイベント。
関数は引数 evt および ui を受け取ります。
ui.oldItem を使用して、以前選択されたデータ項目への参照を取得します。
ui.newItem を使用して、現在選択されたデータ項目への参照を取得します。コード サンプル
// Bind $(document).delegate(".selector", "igpiechartselecteditemchanged", function (evt, ui) { // Use ui.oldItem to get a reference to the previous selected data item. ui.oldItem; // Use ui.newItem to get a reference to the current selected data item. ui.newItem; }); // Initialize $(".selector").igPieChart({ selectedItemChanged: function (evt, ui) { ... } }); -
selectedItemChanging
- キャンセル可能:
- true
selectedItem オプションが変更するときに発生するイベント。
関数は引数 evt および ui を受け取ります。
ui.oldItem を使用して、現在選択されたデータ項目への参照を取得します。
ui.newItem を使用して、新しく選択されたデータ項目への参照を取得します。コード サンプル
// Bind $(document).delegate(".selector", "igpiechartselecteditemchanging", function (evt, ui) { // Use ui.oldItem to get a reference to the current selected data item. ui.oldItem; // Use ui.newItem to get a reference to the newly selected data item. ui.newItem; // Use ui.cancel to stop the selected item from changing. ui.cancel; }); // Initialize $(".selector").igPieChart({ selectedItemChanging: function (evt, ui) { ... } }); -
selectedItemsChanged
- キャンセル可能:
- false
selectedItems 配列が変更したときに発生するイベント。
関数は引数 evt および ui を受け取ります。
ui.oldItems を使用して、以前選択されたデータ項目への参照を取得します。
ui.newItems を使用して、現在選択されたデータ項目への参照を取得します。コード サンプル
// Bind $(document).delegate(".selector", "igpiechartselecteditemschanged", function (evt, ui) { // Use ui.oldItems to get a reference to the previous selected data item. ui.oldItems; // Use ui.newItems to get a reference to the current selected data item. ui.newItems; }); // Initialize $(".selector").igPieChart({ selectedItemsChanged: function (evt, ui) { ... } }); -
selectedItemsChanging
- キャンセル可能:
- true
selectedItems 配列が変更するときに発生するイベント。
関数は引数 evt および ui を受け取ります。
ui.oldItems を使用して、現在選択されたデータ項目への参照を取得します。
ui.newItems を使用して、新しく選択されたデータ項目への参照を取得します。コード サンプル
// Bind $(document).delegate(".selector", "igpiechartselecteditemschanging", function (evt, ui) { // Use ui.oldItems to get a reference to the current selected data items. ui.oldItems; // Use ui.newItems to get a reference to the newly selected data items. ui.newItems; // Use ui.cancel to stop the selected items from changing. ui.cancel; }); // Initialize $(".selector").igPieChart({ selectedItemsChanging: function (evt, ui) { ... } }); -
sliceClick
- キャンセル可能:
- false
スライスがクリックされたときに発生します。
関数は引数 evt および ui を受け取ります。
チャート オブジェクトへの参照を取得するには ui.chart を使用します。
スライス オブジェクトへの参照を取得するには ui.slice を使用します。
現在の円チャート項目への参照を取得するには ui.slice.item を使用します。
スライスが展開されるかどうかを決定するには ui.slice.isExploded を使用します。
スライスが選択されるかどうかを決定するには ui.slice.isSelected を使用します。コード サンプル
// Bind $(document).delegate(".selector", "igpiechartsliceclick", function (evt, ui) { //Use ui.chart to get reference to chart object. ui.chart; //Use ui.slice to get reference to slice object. ui.slice; //Use ui.slice.item to get reference to current pie chart item. ui.slice.item; //Use ui.slice.isExploded to get is the slice exploded. ui.slice.isExploded; //Use ui.slice.isSelected to get is the slice selected. ui.slice.isSelected; }); //Initialize $(".selector").igPieChart({ sliceClick: function (evt, ui) { ... } }); -
tooltipHidden
- キャンセル可能:
- false
ツールチップが非表示になった後に発生するイベント。
関数は引数 evt および ui を受け取ります。
ツールチップの DOM 要素への参照を取得するには ui.element を使用します。
現在の円チャート項目への参照を取得するには ui.item を使用します。
チャート オブジェクトへの参照を取得するには ui.chart を使用します。コード サンプル
// Bind $(document).delegate(".selector", "igpiecharttooltiphidden", function (evt, ui) { //Use ui.element to get reference to tooltip DOM element. ui.element; //Use ui.item to get reference to current series item object. ui.item; //Use ui.chart to get reference to chart object. ui.chart; }); //Initialize $(".selector").igPieChart({ tooltipHidden: function (evt, ui) { ... } }); -
tooltipHiding
- キャンセル可能:
- true
マウスが要素から離れ、ツールチップが非表示になるときに発生するイベント。
関数は引数 evt および ui を受け取ります。
ツールチップの DOM 要素への参照を取得するには ui.element を使用します。
現在の円チャート項目への参照を取得するには ui.item を使用します。
チャート オブジェクトへの参照を取得するには ui.chart を使用します。コード サンプル
// Bind $(document).delegate(".selector", "igpiecharttooltiphiding", function (evt, ui) { //Use ui.element to get reference to tooltip DOM element. ui.element; //Use ui.item to get reference to current series item object. ui.item; //Use ui.chart to get reference to chart object. ui.chart; }); //Initialize $(".selector").igPieChart({ tooltipHiding: function (evt, ui) { ... } }); -
tooltipShowing
- キャンセル可能:
- true
ツールチップを表示するためにマウスが十分な期間要素上をホバーしたときに発生するイベント。
関数は引数 evt および ui を受け取ります。
ツールチップの DOM 要素への参照を取得するには ui.element を使用します。
現在の円チャート項目への参照を取得するには ui.item を使用します。
チャート オブジェクトへの参照を取得するには ui.chart を使用します。コード サンプル
// Bind $(document).delegate(".selector", "igpiecharttooltipshowing", function (evt, ui) { //Use ui.element to get reference to tooltip DOM element. ui.element; //Use ui.item to get reference to current series item object. ui.item; //Use ui.chart to get reference to chart object. ui.chart; }); //Initialize $(".selector").igPieChart({ tooltipShowing: function (evt, ui) { ... } }); -
tooltipShown
- キャンセル可能:
- false
ツールチップが表示された後に発生するイベント。
関数は引数 evt および ui を受け取ります。
ツールチップの DOM 要素への参照を取得するには ui.element を使用します。
現在の円チャート項目への参照を取得するには ui.item を使用します。
チャート オブジェクトへの参照を取得するには ui.chart を使用します。コード サンプル
//  Bind
$(document).delegate(".selector", "igpiecharttooltipshown", function (evt, ui) {
      //Use ui.element to get reference to tooltip DOM element.
      ui.element;

      //Use ui.item to get reference to current series item object.
      ui.item;

	  //Use ui.chart to get reference to chart object.
      ui.chart;
});

//Initialize
$(".selector").igPieChart({
    tooltipShown: function (evt, ui) { ... }
});
-
addItem
- .igPieChart( "addItem", item:object );
新しい項目をデータ ソースに追加し、チャートに通知します。
- item
- タイプ:object
- データ ソースに追加される新しい項目。
コード サンプル
$(".selector").igPieChart("addItem", {"Item1": "Value1", "Item2": 1000, "Item3": 1019.75} ); -
changeGlobalLanguage
継承- .igPieChart( "changeGlobalLanguage" );
ウィジェットの言語をグローバルの言語に変更します。グローバルの言語は $.ig.util.language の値です。
コード サンプル
$(".selector").igPieChart("changeGlobalLanguage"); -
changeGlobalRegional
継承- .igPieChart( "changeGlobalRegional" );
ウィジェットの地域設定をグローバルの地域設定に変更します。グローバルの地域設定は $.ig.util.regional にあります。
コード サンプル
$(".selector").igPieChart("changeGlobalRegional"); -
changeLocale
継承- .igPieChart( "changeLocale", $container:object );
指定したコンテナーに含まれるすべてのロケールを options.language で指定した言語に変更します。
注: このメソッドは珍しいシナリオのみで使用されます。language または locale オプションのセッターを参照してください。- $container
- タイプ:object
- オプションのパラメーター: 設定しない場合、ウィジェットの要素を $container として使用します。
コード サンプル
$(".selector").igPieChart("changeLocale"); -
destroy
- .igPieChart( "destroy" );
ウィジェットを破棄します。
コード サンプル
$(".selector").igPieChart("destroy"); -
exportImage
- .igPieChart( "exportImage", [width:object], [height:object] );
- 返却型:
- object
- 返却型の説明:
- IMG DOM 要素を返します。
チャートを PNG 画像にエクスポートします。
- width
- タイプ:object
- オプション
- 画像の幅。
- height
- タイプ:object
- オプション
- 画像の高さ。
コード サンプル
var image = $(".selector").igPieChart("exportImage", "500", "500"); -
exportVisualData
- .igPieChart( "exportVisualData" );
ユニット テストで支援するために円チャートからビジュアル データをエクスポートします。
コード サンプル
var visualData = $(".selector").igPieChart("exportVisualData"); -
flush
- .igPieChart( "flush" );
続行の前に保留中の作業をチャートで描画するように強制します。
-
getData
- .igPieChart( "getData" );
- 返却型:
- object
- 返却型の説明:
- 円チャートのデータ ソース。
円チャートにバインドされるデータを返します。
-
id
- .igPieChart( "id" );
- 返却型:
- string
チャートを含む親要素の ID を返します。
コード サンプル
var containerElement = $(".selector").igPieChart("id"); -
insertItem
- .igPieChart( "insertItem", item:object, index:number );
新しい項目をデータ ソースに挿入し、チャートに通知します。
- item
- タイプ:object
- データ ソースに挿入される新しい項目。.
- index
- タイプ:number
- 新しい項目が挿入されるデータ ソースのインデックス。
コード サンプル
$(".selector").igPieChart("insertItem", {"Item1": "Value1", "Item2": 1000, "Item3": 1019.75}, 5 ); -
option
- .igPieChart( "option" );
-
print
- .igPieChart( "print" );
チャートを表示する印刷プレビュー ページを作成し、ページのすべての他の要素を非表示にします。
コード サンプル
$(".selector").igDataChart("print"); -
removeItem
- .igPieChart( "removeItem", index:number );
項目をデータ ソースから削除し、チャートに通知します。
- index
- タイプ:number
- 項目が削除されるデータ ソースのインデックス。
コード サンプル
$(".selector").igPieChart("removeItem", 5 ); -
setItem
- .igPieChart( "setItem", index:number, item:object );
データ ソース内の項目を更新し、チャートに通知します。
- index
- タイプ:number
- 変更するデータ ソースのインデックス。
- item
- タイプ:object
- データ ソースに設定する新しい項目。
コード サンプル
$(".selector").igPieChart("setItem", 5, {"Item1": "Value1", "Item2": 1000, "Item3": 1019.75} ); -
widget
- .igPieChart( "widget" );
チャートを含む要素を返します。
コード サンプル
var widget = $(".selector").igPieChart("widget");
-
ui-corner-all ui-widget-content ui-chart-piechart-container
- div 要素に適用されるクラスを取得または設定します。
-
ui-chart-tooltip ui-widget-content ui-corner-all
- ツールチップ div 要素に適用されるクラスを取得または設定します。
-
ui-html5-non-html5-supported-message ui-helper-clearfix ui-html5-non-html5
- HTML 5 非互換のブラウザでチャートが開かれたときに表示される div 要素に適用されるクラスを取得または設定します。