ui.igFunnelChart
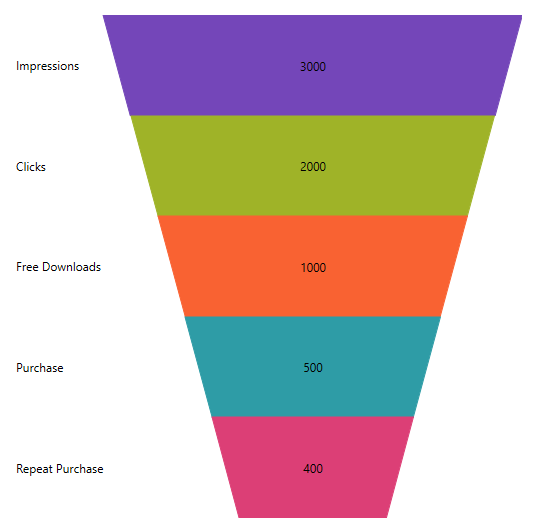
igFunnelChart™ は、データをファンネル シェイプで表示するファンネル チャート コントロールです。 上限値と下限値によるスライスでデータを表現するトップダウン構成の複数セクションを表示します。
以下のコード スニペットは、igFunnelChart コントロールを初期化する方法を示します。
この API を使用して作業を開始するための情報はここをクリックしてください。igGrid コントロールの必要なスクリプトおよびテーマを参照する方法については、 「Ignite UI で JavaScript リソースを使用する」および Ignite UI のスタイル設定とテーマを参照してください。コード サンプル
<!doctype html>
<html>
<head>
    <!-- Infragistics Combined CSS -->
    <link href="css/themes/infragistics/infragistics.theme.css" rel="stylesheet" type="text/css" />
    <link href="css/structure/infragistics.css" rel="stylesheet" type="text/css" />
    <!-- jQuery Core -->
    <script src="js/jquery.js" type="text/javascript"></script>
    <!-- jQuery UI -->
    <script src="js/jquery-ui.js" type="text/javascript"></script>
    <!-- Infragistics Combined Scripts -->
    <script src="js/infragistics.core.js" type="text/javascript"></script>
    <script src="js/infragistics.dv.js" type="text/javascript"></script>
    <script type="text/javascript">
        var data = [
            { Budget: 30, Department: "Administration" },
            { Budget: 50, Department: "Sales" },
            { Budget: 60, Department: "IT" },
            { Budget: 50, Department: "Marketing" },
            { Budget: 100, Department: "Development" },
            { Budget: 20, Department: "Support" }
        ];

        $(function () {
            $("#chart").igFunnelChart({
                width: "100%",
                height: "450px",
                dataSource: data,
                valueMemberPath: "Budget",
                innerLabelMemberPath: "Budget",
                innerLabelVisibility: "visible",
                outerLabelMemberPath: "Department",
                outerLabelVisibility: "visible"
            });
        });
    </script>
</head>
<body>
    <div id="chart"></div>
</body>
</html>
関連サンプル
関連トピック
依存関係
-
allowSliceSelection
- タイプ:
- bool
- デフォルト:
- false
スライスの選択を許可するかどうかを取得または設定します。
コード サンプル
// Initialize $(".selector").igFunnelChart({ allowSliceSelection : true }); // Get var selection = $(".selector").igFunnelChart("option", "allowSliceSelection"); // Set $(".selector").igFunnelChart("option", "allowSliceSelection", true); -
bezierPoints
- タイプ:
- string
- デフォルト:
- null
ベジエ ポイントの上または下の値を取得または設定します。オプションは、useBezierCurve が有効な場合のみ効果があります。
値は、空白文字で区切られた 0 から 1 の範囲の 4 つの数値を提供します。
最初の数字は、x の上の位置、 2 番目は y の上の位置、3 番目は x の下の位置、4 番目は y の下の位置を定義します。
null または無効な値が内部デフォト ("0.5 0 0.5 1") をリセットします。
例:
bezierPoints: "0.4 0.1 0.6 1"。コード サンプル
// Initialize $(".selector").igFunnelChart({ bezierPoints : "0.3 0.1 0.7 1" }); // Get var points = $(".selector").igFunnelChart("option", "bezierPoints"); // Set $(".selector").igFunnelChart("option", "bezierPoints", "0.3 0.1 0.7 1"); -
bottomEdgeWidth
- タイプ:
- number
- デフォルト:
- 0.35
ファンネルに必要な下端のスペースの割合 (0 から 1) を取得または設定します。
コード サンプル
// Initialize $(".selector").igFunnelChart({ bottomEdgeWidth : 1 }); // Get var width = $(".selector").igFunnelChart("option", "bottomEdgeWidth"); // Set $(".selector").igFunnelChart("option", "bottomEdgeWidth", 1); -
brushes
- タイプ:
- object
- デフォルト:
- null
スライスの色設定に使用するブラシのパレットを取得または設定します。
提供された値は、css 色文字列またはグラデーションを定義する JavaScript オブジェクトの配列である必要があります。最初の要素は、コレクションの補間モードを指定する RGB または HSV の文字列に設定するオプションがあります。コード サンプル
// Initialize $(".selector").igFunnelChart({ brushes: ["#7DC3D9", "#3e5354", "#9EB5B4", "#5DD1C6", "#AFD1CE", "#2B768E"] }); // Get var brushes = $(".selector").igFunnelChart("option", "brushes"); // Set $(".selector").igFunnelChart("option", "brushes", ["#7DC3D9", "#3e5354", "#9EB5B4", "#5DD1C6", "#AFD1CE", "#2B768E"]); -
dataSource
継承- タイプ:
- object
- デフォルト:
- null
有効なデータ ソースを取得または設定します。
配列またはプリミティブのインスタンス、オブジェクトの配列、$.ig.DataSource のインスタンス、または $.ig.DataSource で有効なデータが可能です。
注: これが文字列に設定され、「dataSourceType」オプションが設定されていない場合、$.ig.JSONPDataSource が使用されます。コード サンプル
// Given the following data... var data1 = [ { "ID": 1, "Cost": 12.5 }, { "ID": 2, "Cost": 18.56 }, { "ID": 3, "Cost": 22.18 }]; // Initialize $(".selector").igFunnelChart({ dataSource: data1 }); // Get var dataSource = $(".selector").igFunnelChart("option", "dataSource"); // Set $(".selector").igFunnelChart("option", "dataSource", data1); -
dataSourceType
継承- タイプ:
- string
- デフォルト:
- null
データ ソースのタイプ (「json」、「xml」など) を取得または設定します。$.ig.DataSource とそのタイプ プロパティのドキュメントを参照してください。
コード サンプル
// Initialize $(".selector").igFunnelChart({ dataSourceType: "array" }); // Get var dataSourceType = $(".selector").igFunnelChart("option", "dataSourceType"); // Set $(".selector").igFunnelChart("option", "dataSourceType", "array"); -
dataSourceUrl
継承- タイプ:
- string
- デフォルト:
- null
リモート データの要求で JSON を送信するために使用される URL を取得または設定します。
コード サンプル
// Initialize $(".selector").igFunnelChart({ dataSourceUrl: "http://www.example.com" }); // Get var dataUrl = $(".selector").igFunnelChart("option", "dataSourceUrl"); // Set $(".selector").igFunnelChart("option", "dataSourceUrl", "http://www.example.com"); -
formatInnerLabel
- タイプ:
- object
- デフォルト:
- null
インナー ラベルのフォーマッタ関数を取得または設定します。関数は文字列を返す必要があるため、3 つのパラメーターを取ります。最初のパラメーターは書式設定する項目の値、2 番目のパラメーターはデータ内の項目のインデックス、3 番目のパラメーターはファンネル チャートへの参照です。
コード サンプル
function formatFunction(val) { return "Label: " + val; }; // Initialize $(".selector").igFunnelChart({ formatInnerLabel : formatFunction }); // Get var func = $(".selector").igFunnelChart("option", "formatInnerLabel"); // Set $(".selector").igFunnelChart("option", "formatInnerLabel", formatFunction); -
formatOuterLabel
- タイプ:
- object
- デフォルト:
- null
アウター ラベルのフォーマッタ関数を取得または設定します。関数は文字列を返す必要があるため、3 つのパラメーターを取ります。最初のパラメーターは書式設定する項目の値、2 番目のパラメーターはデータ内の項目のインデックス、3 番目のパラメーターはファンネル チャートへの参照です。
コード サンプル
function formatFunction(val) { return "Label: " + val; }; // Initialize $(".selector").igFunnelChart({ formatOuterLabel : formatFunction }); // Get var func = $(".selector").igFunnelChart("option", "formatOuterLabel"); // Set $(".selector").igFunnelChart("option", "formatOuterLabel", formatFunction); -
funnelSliceDisplay
- タイプ:
- enumeration
- デフォルト:
- null
ファンネル スライスの高さを設定する方法を取得または設定します。
メンバー
- uniform
- タイプ:string
- スライスの高さは均一である必要があります。
- weighted
- タイプ:string
- スライスの高さは値によって重み付けする必要があります。
コード サンプル
// Initialize $(".selector").igFunnelChart({ funnelSliceDisplay : "uniform" }); // Get var display = $(".selector").igFunnelChart("option", "funnelSliceDisplay"); // Set $(".selector").igFunnelChart("option", "funnelSliceDisplay", "uniform"); -
height
継承- タイプ:
- number
- デフォルト:
- null
チャートの高さ。
コード サンプル
// Initialize $(".selector").igFunnelChart({ height: 250 }); // Get var height = $(".selector").igFunnelChart("option", "height"); // Set $(".selector").igFunnelChart("option", "height", 250); -
innerLabelMemberPath
- タイプ:
- string
- デフォルト:
- null
現在のシリーズ オブジェクトの InnerLabel マッピング プロパティを取得または設定します。
コード サンプル
// Initialize $(".selector").igFunnelChart({ innerLabelMemberPath : "value" }); // Get var path = $(".selector").igFunnelChart("option", "innerLabelMemberPath"); // Set $(".selector").igFunnelChart("option", "innerLabelMemberPath", "value"); -
innerLabelVisibility
- タイプ:
- enumeration
- デフォルト:
- visible
インナー ラベルが表示されるかどうかを取得または設定します。
メンバー
- visible
- タイプ:string
- 要素を表示します。
- collapsed
- タイプ:string
- 要素を表示しません。
コード サンプル
// Initialize $(".selector").igFunnelChart({ innerLabelVisibility : "visible" }); // Get var visibility = $(".selector").igFunnelChart("option", "innerLabelVisibility"); // Set $(".selector").igFunnelChart("option", "innerLabelVisibility", "visible"); -
isInverted
- タイプ:
- bool
- デフォルト:
- false
ファンネルが反転して描画されるかどうかを取得または設定します。
コード サンプル
// Initialize $(".selector").igFunnelChart({ isInverted : true }); // Get var inverted = $(".selector").igFunnelChart("option", "isInverted"); // Set $(".selector").igFunnelChart("option", "isInverted", true); -
legend
- タイプ:
- object
- デフォルト:
- null
チャートの凡例を取得または設定します。
既存の html 要素の id のある文字列にできるオプションの値。要素は空で igChartLegend ウィジェットを作成するために使用されます。
要素が見つからない場合、新しい DIV 要素が作成され、チャート要素の後の親に挿入されます。
凡例要素の id を含む、メンバー要素のあるオブジェクトにできるオプションの値。
この場合、オブジェクトは、幅、高さ、イベントなど igChartLegend ウィジェットでサポートされるオプションを含みます (legendItemMouseLeftButtonDown、legendItemMouseEnter など)。
実例:
legend: {}
legend: "idOfDiv"
legend: { element: "idOfDiv", width: 300 }
legend: { legendItemMouseLeftButtonDown: function (evt, ui) { ui.chart.toggleSelection(ui.item); } }.コード サンプル
// Initialize $(".selector").igFunnelChart({ legend : "legendId" }); // Get var legend = $(".selector").igFunnelChart("option", "legend"); // Set $(".selector").igFunnelChart("option", "legend", "legendId"); -
legendItemBadgeTemplate
- タイプ:
- object
- デフォルト:
- null
凡例項目に使用する LegendItemBadgeTemplate を取得または設定します。
提供されるオブジェクトには、描画とオプションでメジャーと呼ばれるプロパティがあります。
これらはユーザー指定のカスタム描画を処理するために呼び出される関数です。
measure は以下のようなオブジェクトを渡されます:
{
context: [特定のテンプレートのシナリオに基づいて DOM 要素または CanvasContext2D のいずれか],
width: [値が存在する場合、使用可能な幅を指定します。ユーザーはコンテンツのために希望の幅を設定できます],
height: [値が存在する場合、使用可能な高さを指定します。ユーザーはコンテンツのために希望の高さを設定できます],
isConstant: [希望の幅と高さが常にこのテンプレートに対して同じである場合には、ユーザーは True に設定する必要があります],
data: [存在する場合、このテンプレートのコンテキストでを表します]
}
render は以下のようなオブジェクトを渡されます:
{
context: [特定のテンプレートのシナリオに基づいて DOM 要素または CanvasContext2D のいずれか],
xPosition: [存在する場合、コンテンツを描画する x 位置を指定します],
yPosition: [存在する場合、コンテンツを描画する y 位置を指定します],
availableWidth: [存在する場合、コンテンツを描画する使用可能な幅を指定します],
availableHeight: [存在する場合、コンテンツを描画する使用可能な高さを指定します],
data: [存在する場合、このコンテキストのためにコンテキストにあるデータを指定します],
isHitTestRender: [true の場合、これがヒットテストのために特別な描画パスであることを指定します。この場合データからのブラシを使用する必要があります]
}。コード サンプル
// Initialize $(".selector").igFunnelChart({ legendItemBadgeTemplate: { measure: function(measureInfo) { measureInfo.context; // either a DOM element or a CanvasContext2D depending on the particular template scenario measureInfo.width; // if value is present, specifies the available width, user may set to desired width for content measureInfo.height; // if value is present, specifies the available height, user may set to desired height for content measureInfo.isConstant; // user should set to true if desired with and height will always be the same for this template measureInfo.data; // if present, represents the contextual data for this template] }, render: function (renderInfo) { renderInfo.context; // either a DOM element or a CanvasContext2D depending on the particular template scenario renderInfo.xPosition; // if present, specifies the x position at which to render the content renderInfo.yPosition; // if present, specifies the y position at which to render the content renderInfo.availableWidth; // if present, specifies the available width in which to render the content renderInfo.availableHeight; // if present, specifies the available height in which to render the content renderInfo.data; // if present, specifies the data that is in context for this content renderInfo.isHitTestRender; // if true, indicates that this is a special render pass for hit testing, in which case the brushes from the data should be used } } }); -
maxRecCount
継承- タイプ:
- number
- デフォルト:
- 0
チャートに表示されるレコードの最大数を取得または設定します。
コード サンプル
// Initialize $(".selector").igFunnelChart({ maxRecCount: 10 }); // Get var maxRecCount = $(".selector").igFunnelChart("option", "maxRecCount"); // Set $(".selector").igFunnelChart("option", "maxRecCount", 10); -
outerLabelAlignment
- タイプ:
- enumeration
- デフォルト:
- null
アウター ラベルを表示するチャートの端を取得または設定します。
メンバー
- left
- タイプ:string
- ラベルはチャートの左側に表示されます。
- right
- タイプ:string
- ラベルはチャートの右側に表示されます。
コード サンプル
// Initialize $(".selector").igFunnelChart({ outerLabelAlignment : "left" }); // Get var alignment = $(".selector").igFunnelChart("option", "outerLabelAlignment"); // Set $(".selector").igFunnelChart("option", "outerLabelAlignment", "left"); -
outerLabelMemberPath
- タイプ:
- string
- デフォルト:
- null
現在のシリーズ オブジェクトの OuterLabel マッピング プロパティを取得または設定します。
コード サンプル
// Initialize $(".selector").igFunnelChart({ outerLabelMemberPath : "value" }); // Get var path = $(".selector").igFunnelChart("option", "outerLabelMemberPath"); // Set $(".selector").igFunnelChart("option", "outerLabelMemberPath", "value"); -
outerLabelTextColor
- タイプ:
- string
- デフォルト:
- null
外部ラベルで使用するブラシを取得または設定します。
コード サンプル
// Initialize $(".selector").igFunnelChart({ outerLabelTextColor : "black" }); // Get var textColor = $(".selector").igFunnelChart("option", "outerLabelTextColor"); // Set $(".selector").igFunnelChart("option", "outerLabelTextColor", "black"); -
outerLabelTextStyle
- タイプ:
- string
- デフォルト:
- null
アウター ラベルのテキスト スタイルを取得または設定します。
コード サンプル
// Initialize $(".selector").igFunnelChart({ outerLabelTextStyle : "16pt Verdona" }); // Get var textStyle = $(".selector").igFunnelChart("option", "outerLabelTextStyle"); // Set $(".selector").igFunnelChart("option", "outerLabelTextStyle", "16pt Verdona"); -
outerLabelVisibility
- タイプ:
- enumeration
- デフォルト:
- collapsed
アウター ラベルが表示されるかどうかを設定または取得します。
メンバー
- visible
- タイプ:string
- 要素を表示します。
- collapsed
- タイプ:string
- 要素を表示しません。
コード サンプル
// Initialize $(".selector").igFunnelChart({ outerLabelVisibility : "visible" }); // Get var visibility = $(".selector").igFunnelChart("option", "outerLabelVisibility"); // Set $(".selector").igFunnelChart("option", "outerLabelVisibility", "visible"); -
outlines
- タイプ:
- object
- デフォルト:
- null
スライスのアウトラインに使用するブラシのパレットを取得または設定します。
提供された値は、css 色文字列またはグラデーションを定義する JavaScript オブジェクトの配列である必要があります。最初の要素は、コレクションの補間モードを指定する RGB または HSV の文字列に設定するオプションがあります。コード サンプル
// Initialize $(".selector").igFunnelChart({ outlines : [ "#3189A6", "#212D2E", "#5C7877", "#2FA498", "#487D78", "#163F4B" ] }); // Get var visibility = $(".selector").igFunnelChart("option", "outlines"); // Set $(".selector").igFunnelChart("option", "outlines", [ "#3189A6", "#212D2E", "#5C7877", "#2FA498", "#487D78", "#163F4B" ]); -
outlineThickness
- タイプ:
- number
- デフォルト:
- -1
スライスの周りのアウトラインの太さを取得または設定します。
コード サンプル
// Initialize $(".selector").igFunnelChart({ outlineThickness : 1 }); // Get var thickness = $(".selector").igFunnelChart("option", "outlineThickness"); // Set $(".selector").igFunnelChart("option", "outlineThickness", 1); -
pixelScalingRatio
- タイプ:
- number
- デフォルト:
- NaN
コントロールのピクセル密度に影響するために使用されるスケール値を取得または設定します。
より高いスケール比率はビジュアルを向上しますが、メモリの使用を増加します。より低い値はコントロールをぼやけます。コード サンプル
// Initialize $(".selector").igFunnelChart({ pixelScalingRatio: 2 }); // Get var pixelScalingRatio = $(".selector").igFunnelChart("option", "pixelScalingRatio"); // Set $(".selector").igFunnelChart("option", "pixelScalingRatio", 2); -
responseDataKey
継承- タイプ:
- string
- デフォルト:
- null
$.ig.DataSource を参照してください。応答がラップされる場合、これは基本的にデータ レコードが保持される応答内のプロパティです。
コード サンプル
// Initialize $(".selector").igFunnelChart({ responseDataKey: "Records" }); // Get var responseDataKey = $(".selector").igFunnelChart("option", "responseDataKey"); // Set $(".selector").igFunnelChart("option", "responseDataKey", "Records"); -
responseTotalRecCountKey
継承- タイプ:
- string
- デフォルト:
- null
$.ig.DataSource を参照してください。サーバー上のレコードの総数を指定する応答内のプロパティ。
コード サンプル
// Initialize $(".selector").igFunnelChart({ responseTotalRecCountKey: "RecordCount" }); // Get var responseTotalRecCountKey = $(".selector").igFunnelChart("option", "responseTotalRecCountKey"); // Set $(".selector").igFunnelChart("option", "responseTotalRecCountKey", "RecordCount"); -
selectedSliceStyle
- タイプ:
- object
- デフォルト:
- null
選択されているスライスに使用するスタイルを設定または取得します。
ストローク (アウトラインの色)、塗りつぶし (背景色)、不透明度を設定するために使用できます。コード サンプル
// Initialize $(".selector").igFunnelChart({ selectedSliceStyle: { fill: "lightblue", stroke: "black" } }); // Get var style = $(".selector").igFunnelChart("option", "selectedSliceStyle"); // Set $(".selector").igFunnelChart("option", "selectedSliceStyle", { fill: "lightblue", stroke: "black" }); -
textColor
- タイプ:
- string
- デフォルト:
- null
内部ラベルで使用するブラシを取得または設定します。
コード サンプル
// Initialize $(".selector").igFunnelChart({ textColor : "white" }); // Get var textColor = $(".selector").igFunnelChart("option", "textColor"); // Set $(".selector").igFunnelChart("option", "textColor", "white"); -
textStyle
- タイプ:
- string
- デフォルト:
- null
インナー ラベルのテキスト スタイルを取得または設定します。
コード サンプル
// Initialize $(".selector").igFunnelChart({ textStyle : "white" }); // Get var textStyle = $(".selector").igFunnelChart("option", "textStyle"); // Set $(".selector").igFunnelChart("option", "textStyle", "white"); -
tooltipTemplate
継承- タイプ:
- string
- デフォルト:
- null
チャート項目に関連付けるツールチップのテンプレートを取得または設定します
例: "Value: $(ValueMemberPathInDataSource)"。コード サンプル
// Given the following data... var data1 = [ { "ID": 1, "Cost": 12.5 }, { "ID": 2, "Cost": 18.56 }, { "ID": 3, "Cost": 22.18 }]; // And the following template... <script id="chartTooltip" type="text/x-jquery-tmpl"> <div> This is custom tooltip content.<br /> <span>${item.ID}</span><br /> <span>${item.Cost}</span><br /> </div> </script> // Initialize $(".selector").igFunnelChart({ tooltipTemplate: chartTooltip }); // Get var template = $(".selector").igFunnelChart("option", "tooltipTemplate"); // Set $(".selector").igFunnelChart("option", "tooltipTemplate", chartTooltip); -
transitionDuration
- タイプ:
- number
- デフォルト:
- 0
アニメーションが実行される期間を取得または設定します。
コード サンプル
// Initialize $(".selector").igFunnelChart({ transitionDuration : 1 }); // Get var thickness = $(".selector").igFunnelChart("option", "transitionDuration"); // Set $(".selector").igFunnelChart("option", "transitionDuration", 1); -
unselectedSliceStyle
- タイプ:
- object
- デフォルト:
- null
選択されていないスライスに使用するスタイルを設定または取得します。
ストローク (アウトラインの色)、塗りつぶし (背景色)、不透明度を設定するために使用できます。コード サンプル
// Initialize $(".selector").igFunnelChart({ unselectedSliceStyle: { fill: "lightblue", stroke: "black" } }); // Get var style = $(".selector").igFunnelChart("option", "unselectedSliceStyle"); // Set $(".selector").igFunnelChart("option", "unselectedSliceStyle", { fill: "lightblue", stroke: "black" }); -
useBezierCurve
- タイプ:
- bool
- デフォルト:
- false
ファンネルを定義するためにベジエ曲線を使用するかどうかを取得または設定します。
コード サンプル
// Initialize $(".selector").igFunnelChart({ useBezierCurve : true }); // Get var isBezier = $(".selector").igFunnelChart("option", "useBezierCurve"); // Set $(".selector").igFunnelChart("option", "useBezierCurve", true); -
useOuterLabelsForLegend
- タイプ:
- bool
- デフォルト:
- false
アウター ラベルを使用して凡例項目を識別するかどうかを取得または設定します。
コード サンプル
// Initialize $(".selector").igFunnelChart({ useOuterLabelsForLegend : true }); // Get var useLabels = $(".selector").igFunnelChart("option", "useOuterLabelsForLegend"); // Set $(".selector").igFunnelChart("option", "useOuterLabelsForLegend", true); -
useUnselectedStyle
- タイプ:
- bool
- デフォルト:
- false
未選択のスライスに未選択のスライスを使用するかどうかを取得または設定します。
コード サンプル
// Initialize $(".selector").igFunnelChart({ useUnselectedStyle : true }); // Get var useUnselected = $(".selector").igFunnelChart("option", "useUnselectedStyle"); // Set $(".selector").igFunnelChart("option", "useUnselectedStyle", true); -
valueMemberPath
- タイプ:
- string
- デフォルト:
- null
ファンネル チャートの値メンバー パスを取得または設定します。
コード サンプル
// Initialize $(".selector").igFunnelChart({ valueMemberPath : "value" }); // Get var path = $(".selector").igFunnelChart("option", "valueMemberPath"); // Set $(".selector").igFunnelChart("option", "valueMemberPath", "value"); -
width
継承- タイプ:
- number
- デフォルト:
- null
チャートの幅。
コード サンプル
// Initialize
$(".selector").igFunnelChart({
    width: 250
});

// Get
var width = $(".selector").igFunnelChart("option", "width");

// Set
$(".selector").igFunnelChart("option", "width", 250);
Ignite UI コントロール イベントの詳細については、
Ignite UI でイベントを使用するを参照してください。
-
dataBinding
継承- キャンセル可能:
- true
データ バインド前に発生するイベント。
データ バインディングをキャンセルするには、false を返します。
関数は最初の引数に null を、2 番目の引数に ui を取ります。
チャート ウィジェットへの参照を取得するために ui.owner を使用します。
$.ig.DataSource のインスタンスへの参照を取得するために ui.dataSource を使用します。コード サンプル
// Delegate $(document).delegate(".selector", "igfunnelchartdatabinding", function (evt, ui) { // Get reference to chart widget. ui.owner; // Get reference to instance of $.ig.DataSource. ui.dataSource; }); // Initialize $(".selector").igFunnelChart({ dataBinding: function (evt, ui) { } }); -
dataBound
継承- キャンセル可能:
- false
データ バインド後に発生するイベント。
関数は最初の引数に null を、2 番目の引数に ui を取ります。
チャート ウィジェットへの参照を取得するために ui.owner を使用します。
チャートで表示される実際のデータの配列への参照を取得するために ui.data を使用します。
$.ig.DataSource のインスタンスへの参照を取得するために ui.dataSource を使用します。コード サンプル
// Delegate $(document).delegate(".selector", "igfunnelchartdatabound", function (evt, ui) { // Gets a reference to chart widget. ui.owner; // Gets a reference to array actual data which is displayed by chart. ui.data; // Gets a reference to instance of $.ig.DataSource. ui.dataSource; }); // Initialize $(".selector").igFunnelChart({ dataBound: function (evt, ui) { } }); -
hideTooltip
継承- キャンセル可能:
- true
ツールチップが非表示になる前に発生されるイベント。
ツールチップの非表示をキャンセルして表示するために false を返します。
関数は最初の引数に null を、2 番目の引数に ui を取ります。
チャート ウィジェットへの参照を取得するために ui.owner を使用します。
項目への参照を取得するために ui.item を使用します。
前回の updateTooltip イベントの更新またはツールチップから ui.element 値を表す jquery オブジェクトへの参照を取得するために ui.element を使用します。カスタム要素で置き換えられるメンバーの値。コード サンプル
// Delegate $(document).delegate(".selector", "igfunnelcharthidetooltip", function (evt, ui) { // Gets a reference to chart widget. ui.owner; // Gets a reference to item. ui.item; // Gets a reference to jquery object which represents tooltip or value of ui.element from last updateTooltip event. ui.element; }); // Initialize $(".selector").igFunnelChart({ hideTooltip: function (evt, ui) { } }); -
sliceClicked
- キャンセル可能:
- false
スライスがクリックされたときに発生するイベント。
関数は最初の引数に null を、2 番目の引数に ui を取ります。
ui.owner を使用して igFunnelChart への参照を取得します。
クリックされたスライスを取得するために ui.index を使用します。
クリックされたスライス項目への参照を取得するために ui.item を使用します。
スライスが選択されたかどうかをチェックするために ui.selected を使用します。コード サンプル
//Delegate $(document).delegate(".selector", "igfunnelchartsliceclicked", function (evt, ui) { // Get reference to igFunnelChart. ui.owner; // Get index of clicked slice. ui.index; // Get reference to clicked data item. ui.item; // Get whether the clicked slice has a selected state. ui.selected; }); // Initialize $(".selector").igFunnelChart({ sliceClicked: function(evt, ui) {...} }); -
updateTooltip
継承- キャンセル可能:
- true
ツールチップが更新される前に発生されるイベント。
ツールチップの更新および非表示をキャンセルするために false を返します。
関数は最初の引数に null を、2 番目の引数に ui を取ります。
チャート ウィジェットへの参照を取得するために ui.owner を使用します。
ツールチップの html を取得するために ui.text を使用します。変更可能なメンバーの値。変更された値が null または空値の場合、現在のツールチップ コンテンツは古い値を保持します。
項目への参照を取得するために ui.item を使用します。変更可能またはカスタム項目で置き換えられるメンバーの値。
ウィジェットに関連するツールチップの左位置をピクセルで取得するために ui.x を使用します。変更可能なメンバーの値。
ウィジェットに関連するツールチップの上位置をピクセルで取得するために ui.y を使用します。変更可能なメンバーの値。
ツールチップを表す jquery オブジェクトへの参照を取得するための ui.element を使用します。カスタム要素で置き換えられるメンバーの値。コード サンプル
// Delegate
$(document).delegate(".selector", "igfunnelchartupdatetooltip", function (evt, ui) {

    // Gets a reference to chart widget.
    ui.owner;

    // Gets a reference to html of the tooltip.
    ui.text;

    // Gets a reference to the item.
    ui.item;

    // Gets the left position of tooltip in pixels relative to widget.
    ui.x;

    // Gets the top position of tooltip in pixels relative to widget.
    ui.y;

    // Gets a reference to jquery object which represents tooltip.
    ui.element
});

// Initialize
$(".selector").igFunnelChart({
    updateTooltip: function (evt, ui) {

    }
});
-
addItem
継承- .igFunnelChart( "addItem", item:object );
- 返却型:
- object
- 返却型の説明:
- このチャートへの参照を返します。
新しい項目をデータ ソースに追加し、チャートに通知します。
- item
- タイプ:object
- データ ソースに追加する必要がある項目。
コード サンプル
var item1 = {"Item1": "Value1", "Item2": 1000, "Item3": 1019.75}; $(".selector").igFunnelChart("addItem", item1); -
chart
継承- .igFunnelChart( "chart" );
- 返却型:
- object
- 返却型の説明:
- チャートへの参照を返します。
チャート オブジェクトへの参照を取得します。
コード サンプル
var chart = $(".selector").igCategoryChart("chart"); -
dataBind
継承- .igFunnelChart( "dataBind" );
データをチャートにバインドします。
コード サンプル
$(".selector").igCategoryChart("dataBind"); -
destroy
- .igFunnelChart( "destroy" );
ウィジェットを破棄します。
コード サンプル
$(".selector").igFunnelChart("destroy"); -
exportVisualData
- .igFunnelChart( "exportVisualData" );
コード サンプル
var visualData = $(".selector").igCategoryChart("exportVisualData"); -
findIndexOfItem
継承- .igFunnelChart( "findIndexOfItem", item:object );
- 返却型:
- number
- 返却型の説明:
- -1 または項目のインデックスを返します。
チャートに使用される実際のデータ内の項目のインデックスを検索します。
- item
- タイプ:object
- 項目への参照。
コード サンプル
var item1 = {"Item1": "Value1", "Item2": 1000, "Item3": 1019.75}; var itemIndex = $(".selector").igCategoryChart("findIndexOfItem", item1); -
flush
継承- .igFunnelChart( "flush" );
続行の前に保留中の作業をチャートで描画するように強制します。
-
getData
継承- .igFunnelChart( "getData" );
- 返却型:
- array
- 返却型の説明:
- null またはデータへの参照を返します。
チャートに使用される実際のデータへの参照を取得します。
コード サンプル
var data = $(".selector").igCategoryChart("getData"); -
getDataItem
継承- .igFunnelChart( "getDataItem", index:object );
- 返却型:
- object
- 返却型の説明:
- null またはデータ項目への参照を返します。
チャートに使用される実際のデータの項目を取得します。this.getData()[ index ] に似ています。
- index
- タイプ:object
- データ項目のインデックス。
コード サンプル
var item = $(".selector").igCategoryChart("getDataItem", 0); -
insertItem
継承- .igFunnelChart( "insertItem", item:object, index:number );
- 返却型:
- object
- 返却型の説明:
- このチャートへの参照を返します。
新しい項目をデータ ソースに挿入し、チャートに通知します。
- item
- タイプ:object
- データ ソースに挿入する必要がある新規項目。
- index
- タイプ:number
- 新しい項目が挿入されるデータ ソースのインデックス。
コード サンプル
var item1 = {"Item1": "Value1", "Item2": 1000, "Item3": 1019.75}; $(".selector").igCategoryChart("insertItem", item1, 2); -
isSelected
- .igFunnelChart( "isSelected", slice:object );
- 返却型:
- bool
- 返却型の説明:
- スライスが選択された場合に True を返します。
スライスが選択されているかをチェックします。
- slice
- タイプ:object
- スライスのインデックスまたはスライス データ項目への参照。
コード サンプル
var isSelected = $(".selector").igFunnelChart("isSelected", 1); -
notifyClearItems
継承- .igFunnelChart( "notifyClearItems", dataSource:object );
- 返却型:
- object
- 返却型の説明:
- このチャートへの参照を返します。
項目が関連付けられたデータ ソースからクリアされたことをチャートに通知します。
同じ項目のソースを共有しているかどうか、変更の複数のターゲットに通知する必要はありません。- dataSource
- タイプ:object
- 変更が発生したデータ ソース。
コード サンプル
$(".selector").igCategoryChart("notifyClearItems", dataSource); -
notifyInsertItem
継承- .igFunnelChart( "notifyInsertItem", dataSource:object, index:number, newItem:object );
- 返却型:
- object
- 返却型の説明:
- このチャートへの参照を返します。
項目がそのデータ ソースの指定されたインデックスに挿入されたことを対象の軸またはシリーズに通知します。
同じ項目のソースを共有しているかどうか、変更の複数のターゲットに通知する必要はありません。- dataSource
- タイプ:object
- 変更が発生したデータ ソース。
- index
- タイプ:number
- 新しい項目が挿入された項目ソースのインデックス。
- newItem
- タイプ:object
- コレクションに設定された新しい項目。
コード サンプル
var item1 = {"Item1": "Value1", "Item2": 1000, "Item3": 1019.75}; $(".selector").igCategoryChart("notifyInsertItem", dataSource, 1, item1); -
notifyRemoveItem
継承- .igFunnelChart( "notifyRemoveItem", dataSource:object, index:number, oldItem:object );
- 返却型:
- object
- 返却型の説明:
- このチャートへの参照を返します。
項目がそのデータ ソースの指定されたインデックスから削除されたことを対象の軸またはシリーズに通知します。
同じ項目のソースを共有しているかどうか、変更の複数のターゲットに通知する必要はありません。- dataSource
- タイプ:object
- 変更が発生したデータ ソース。
- index
- タイプ:number
- 旧項目の削除元となった項目ソースのインデックス。
- oldItem
- タイプ:object
- コレクションから削除された旧項目。
コード サンプル
var item1 = {"Item1": "Value1", "Item2": 1000, "Item3": 1019.75}; $(".selector").igCategoryChart("notifyRemoveItem", dataSource, 1, item1); -
notifySetItem
継承- .igFunnelChart( "notifySetItem", dataSource:object, index:number, newItem:object, oldItem:object );
- 返却型:
- object
- 返却型の説明:
- このチャートへの参照を返します。
項目が関連付けられたデータ ソースに設定されたことをチャートに通知します。
- dataSource
- タイプ:object
- 変更が発生したデータ ソース。
- index
- タイプ:number
- 変更された項目ソースのインデックス。
- newItem
- タイプ:object
- コレクションに設定された新しい項目。
- oldItem
- タイプ:object
- コレクションで上書きされた旧項目。
コード サンプル
var item1 = {"Item1": "Value1", "Item2": 1000, "Item3": 1019.75}; var item2 = {"Item1": "Value2", "Item2": 500, "Item3": 156.22}; $(".selector").igCategoryChart("notifySetItem", dataSource, 1, item1, item2); -
removeItem
継承- .igFunnelChart( "removeItem", index:number );
- 返却型:
- object
- 返却型の説明:
- このチャートへの参照を返します。
項目をデータ ソースから削除し、チャートに通知します。
- index
- タイプ:number
- 項目が削除されるデータ ソースのインデックス。
コード サンプル
$(".selector").igCategoryChart("removeItem", 1); -
selectedSliceIndexes
- .igFunnelChart( "selectedSliceIndexes", [selection:array] );
- 返却型:
- enumeration
- 返却型の説明:
- 'array|object' を返します。パラメーターが定義されていない場合、選択されたインデックスの配列が返されます。そうでない場合、igFunnelChart への参照を返します。
選択したスライスのインデックスの配列を取得または設定します。
returnType="array|object" パラメータが定義されていない場合、選択されたインデックスの配列が返されます。そうでない場合、igFunnelChart への参照を返します。- selection
- タイプ:array
- オプション
- 配列または選択したスライスのインデックス。
コード サンプル
// Get var selected = $(".selector").igFunnelChart("selectedSliceIndexes"); // Set $(".selector").igFunnelChart("selectedSliceIndexes", [0, 1, 4]); -
selectedSliceItems
- .igFunnelChart( "selectedSliceItems", [selection:array] );
- 返却型:
- enumeration
- 返却型の説明:
- 'array|object' を返します。パラメーターが定義されていない場合、選択された項目の配列が返されます。そうでない場合、igFunnelChart への参照を返します。
選択したスライス項目の配列を取得します。
returnType="array|object" パラメーターが定義されていない場合、選択された項目の配列が返されます。そうでない場合、igFunnelChart への参照を返します。- selection
- タイプ:array
- オプション
- 配列または選択したスライス項目。
コード サンプル
// Get var selected = $(".selector").igFunnelChart("selectedSliceItems"); // Set $(".selector").igFunnelChart("selectedSliceItems", [slice1, slice2, slice3]); -
setItem
継承- .igFunnelChart( "setItem", index:number, item:object );
- 返却型:
- object
- 返却型の説明:
- このチャートへの参照を返します。
データ ソース内の項目を更新し、チャートに通知します。
- index
- タイプ:number
- 変更する必要があるデータ ソース内の項目のインデックス。
- item
- タイプ:object
- データ ソース内で設定する新規項目オブジェクト。
コード サンプル
var item1 = {"Item1": "Value1", "Item2": 1000, "Item3": 1019.75}; $(".selector").igCategoryChart("removeItem", 1, item1); -
toggleSelection
- .igFunnelChart( "toggleSelection", slice:object );
- 返却型:
- object
- 返却型の説明:
- igFunnelChart への参照を返します。
スライスの選択した状態を切り替えます。
- slice
- タイプ:object
- スライスのインデックスまたは slice-data-item への参照。
コード サンプル
$(".selector").igFunnelChart("toggleSelection", 1);
-
ui-funnel ui-corner-all ui-widget-content
- 主要要素 (ui-funnel ui-corner-all ui-widget-content) に適用されるクラスを取得します。
-
ui-funnel-tooltip ui-widget-content ui-corner-all
- ツールチップ要素 (ui-funnel-tooltip ui-widget-content ui-corner-all) に適用されるクラスを取得します。
-
ui-html5-non-html5-supported-message ui-helper-clearfix ui-html5-non-html5
- チャートを HTML5 と互換性のないブラウザーで開いたときに表示されるメイン要素に適用されるクラスを取得します。